


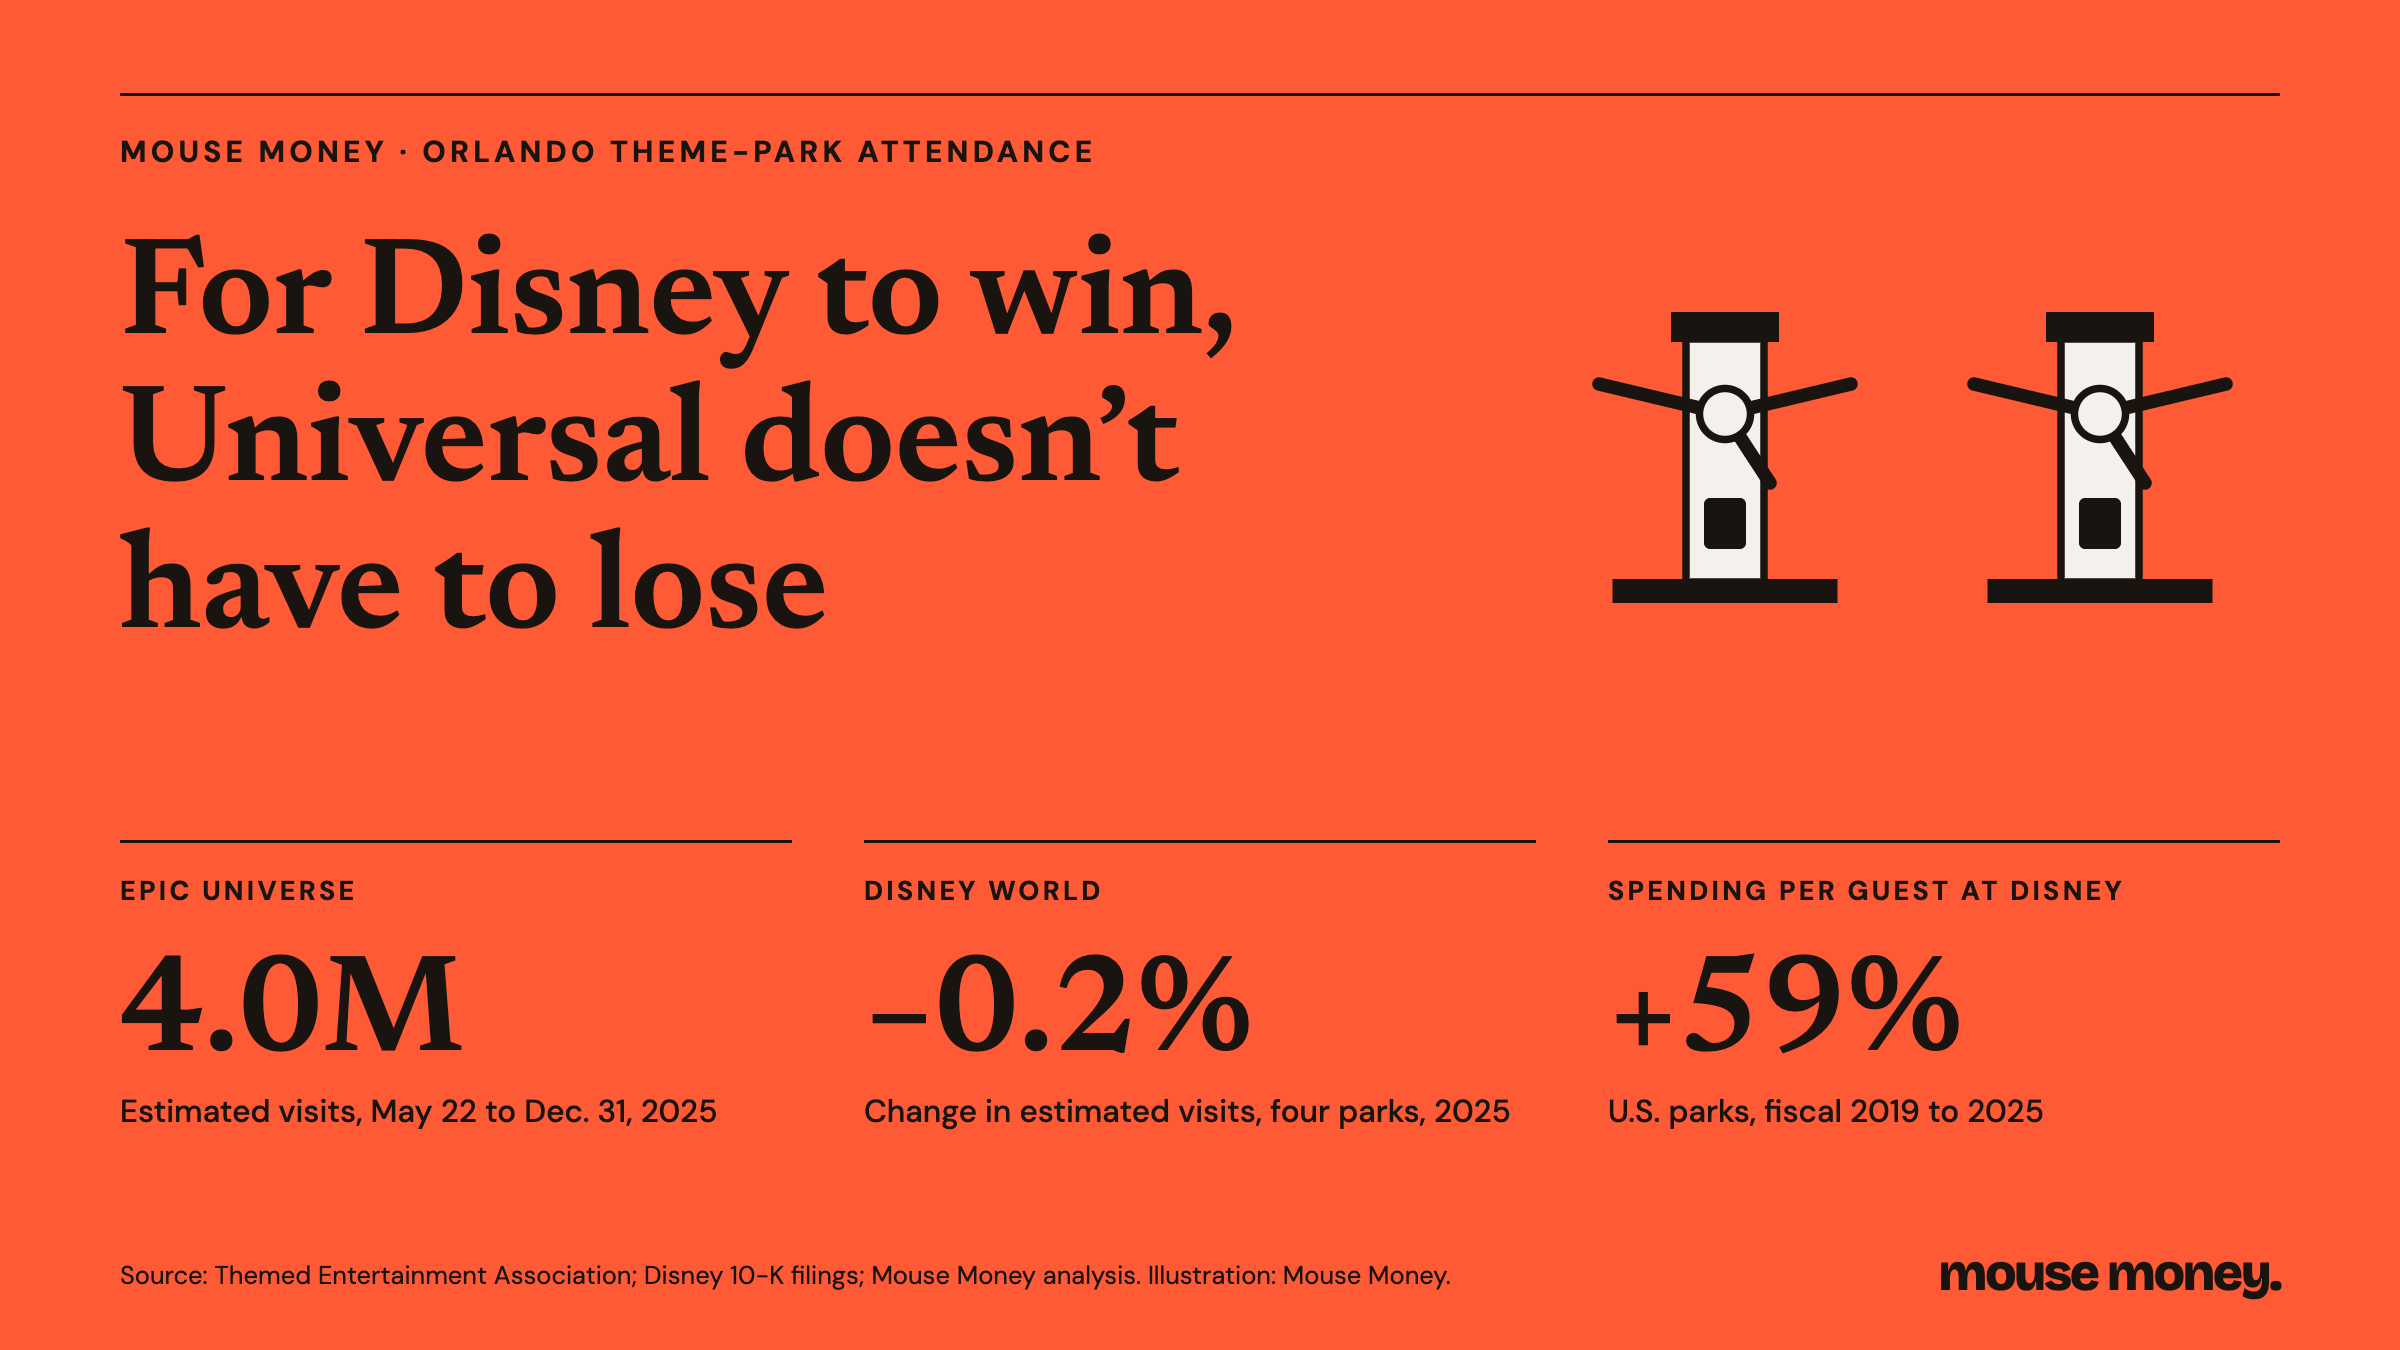
Universal opened its first new Orlando theme park in 26 years in May 2025. By the end of that year, Epic Universe had drawn an estimated four million visits, and attendance at Walt Disney World’s four parks had slipped just 0.2%. For Disney to win in Orlando, the record shows, Universal doesn’t have to lose.
Those figures come from the Themed Entertainment Association’s annual attendance estimates, released Oct. 27, the closest thing the industry has to an official scoreboard. Mouse Money compiled those estimates for every major Orlando park in most years since 2009 and checked them against company filings, hotel data, tourism counts and airport traffic. The review supports the case that the rivalry is not a zero-sum contest. It also found that the comparison those estimates imply, that Disney World remains about 17% below its 2019 attendance, is the one the other evidence supports least.
One new park, one steady incumbent
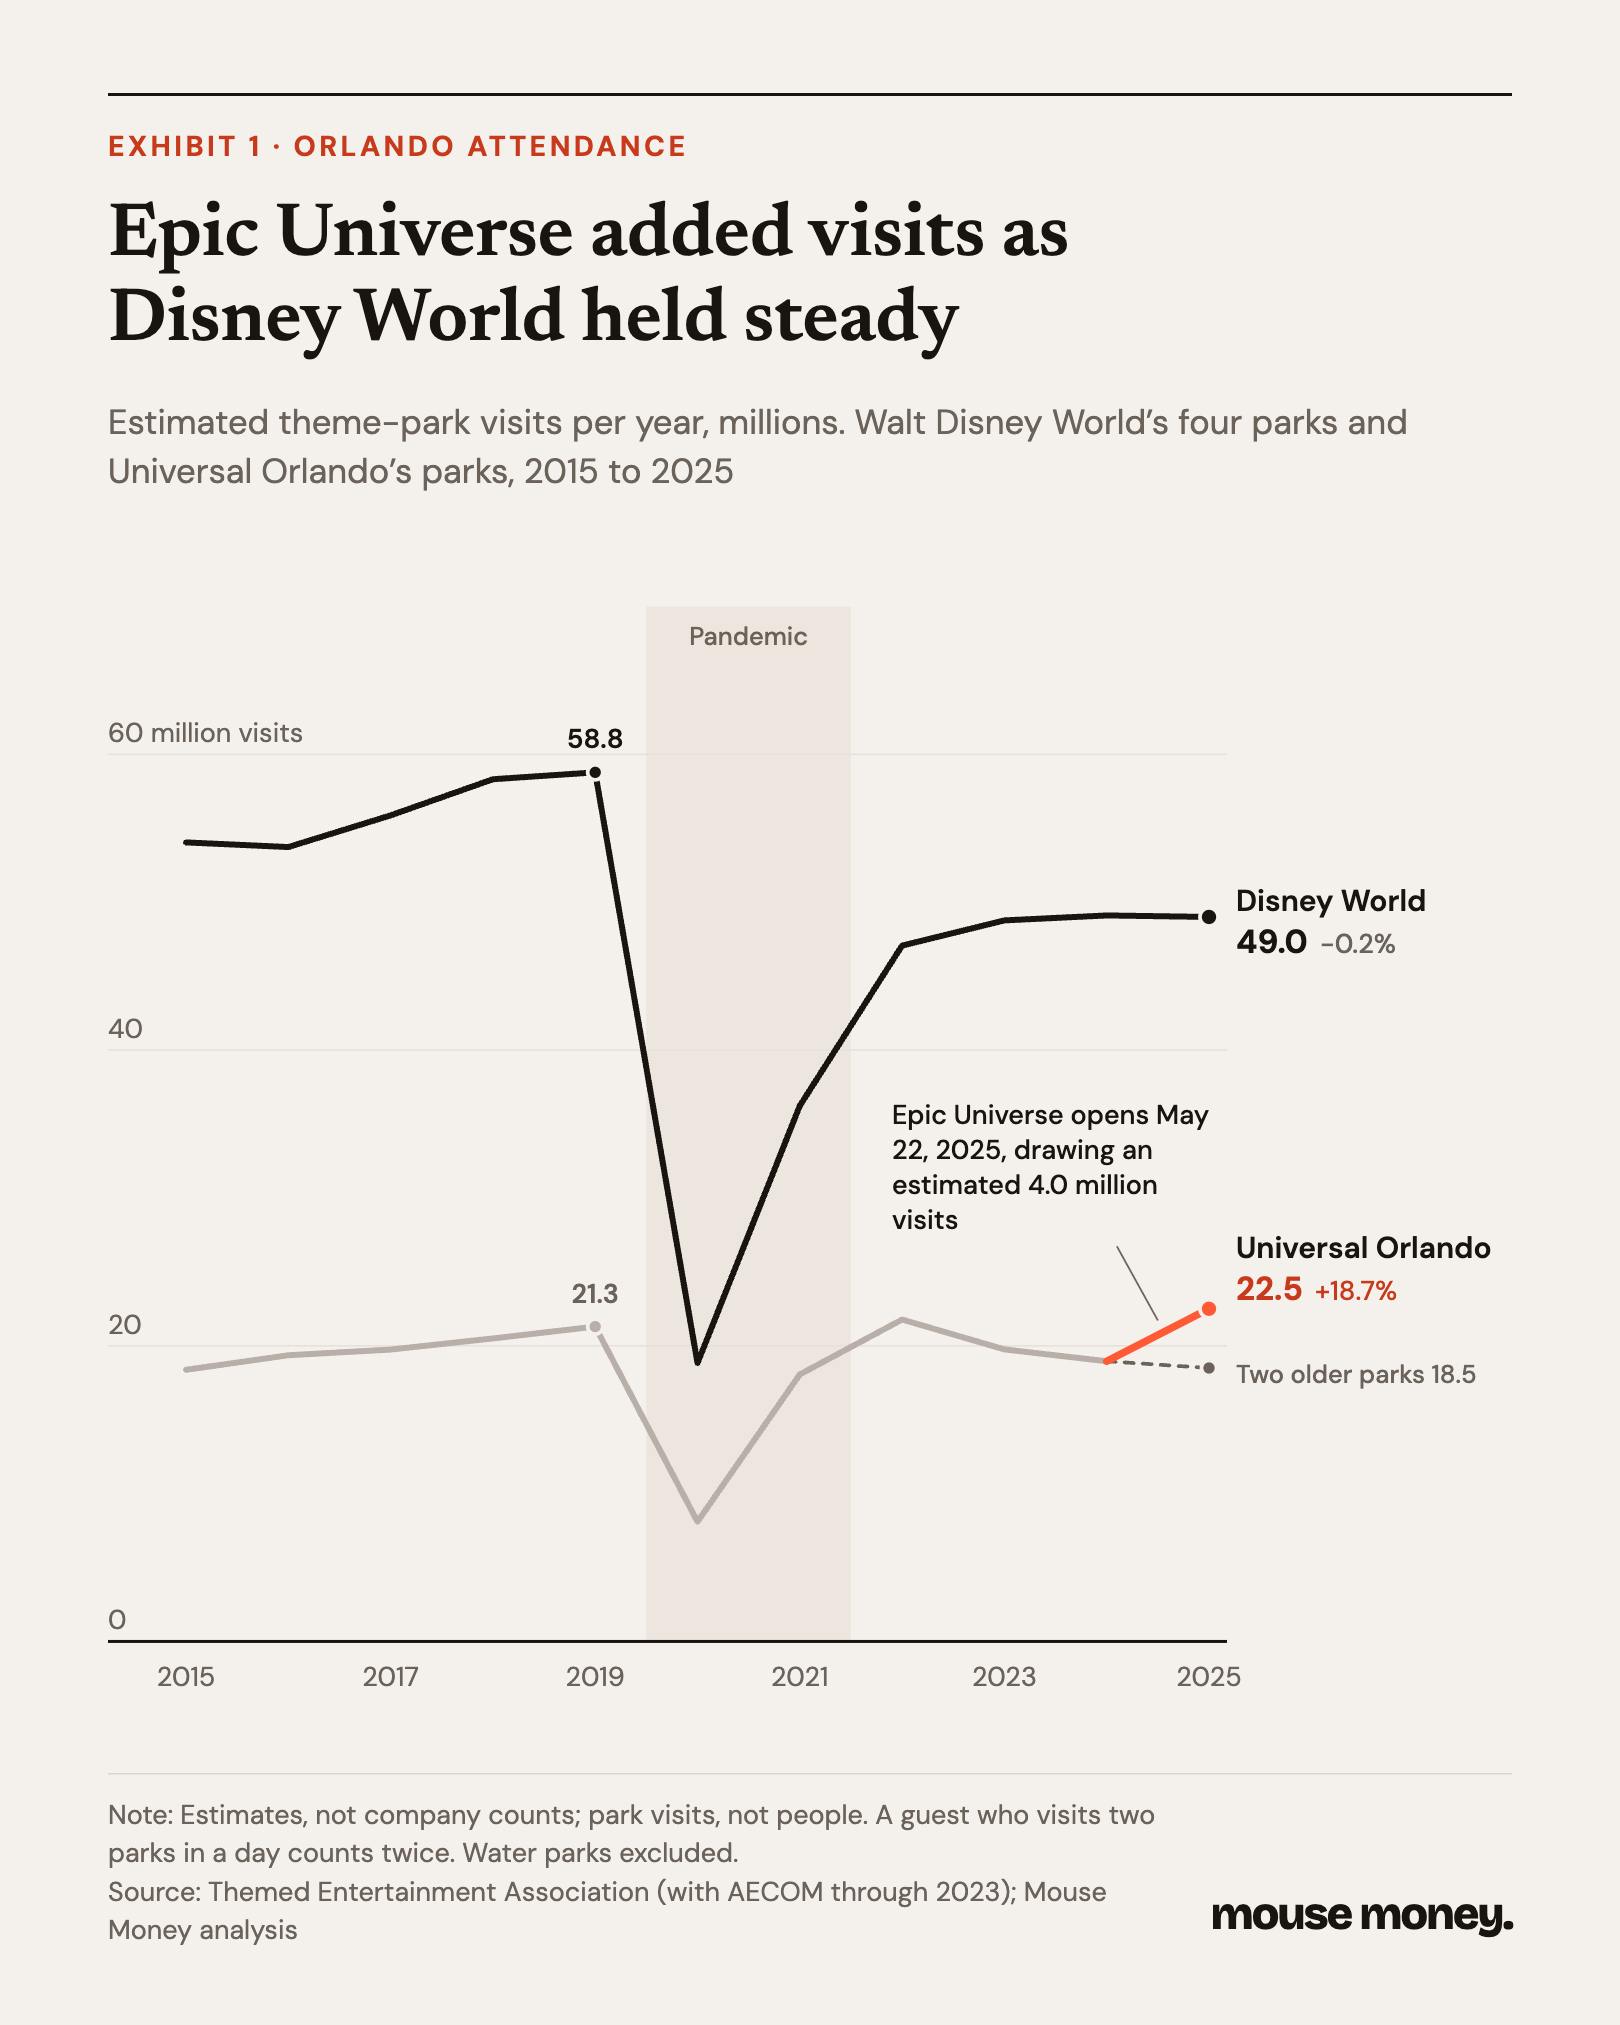
Universal’s Orlando attendance rose about 19% in 2025, to an estimated 22.5 million visits across three parks, according to TEA’s figures as reported by Attractions Magazine. Epic accounted for 4.0 million in roughly seven months of operation. Universal Studios Florida and Islands of Adventure together lost about 450,000 visits, consistent with some guests moving days to the new park.
Disney World’s four parks drew an estimated 49.0 million visits, about 99,000 fewer than in 2024. SeaWorld Orlando, the city’s third major operator, was essentially flat at 4.3 million.
Disney’s own disclosures point the same way. Attendance at its U.S. parks fell 1% in the fiscal year ended Sept. 27, 2025, which included four months of Epic. In the three quarters that followed, the first with Epic open throughout, Disney reported changes of +1%, -1% and +3%.
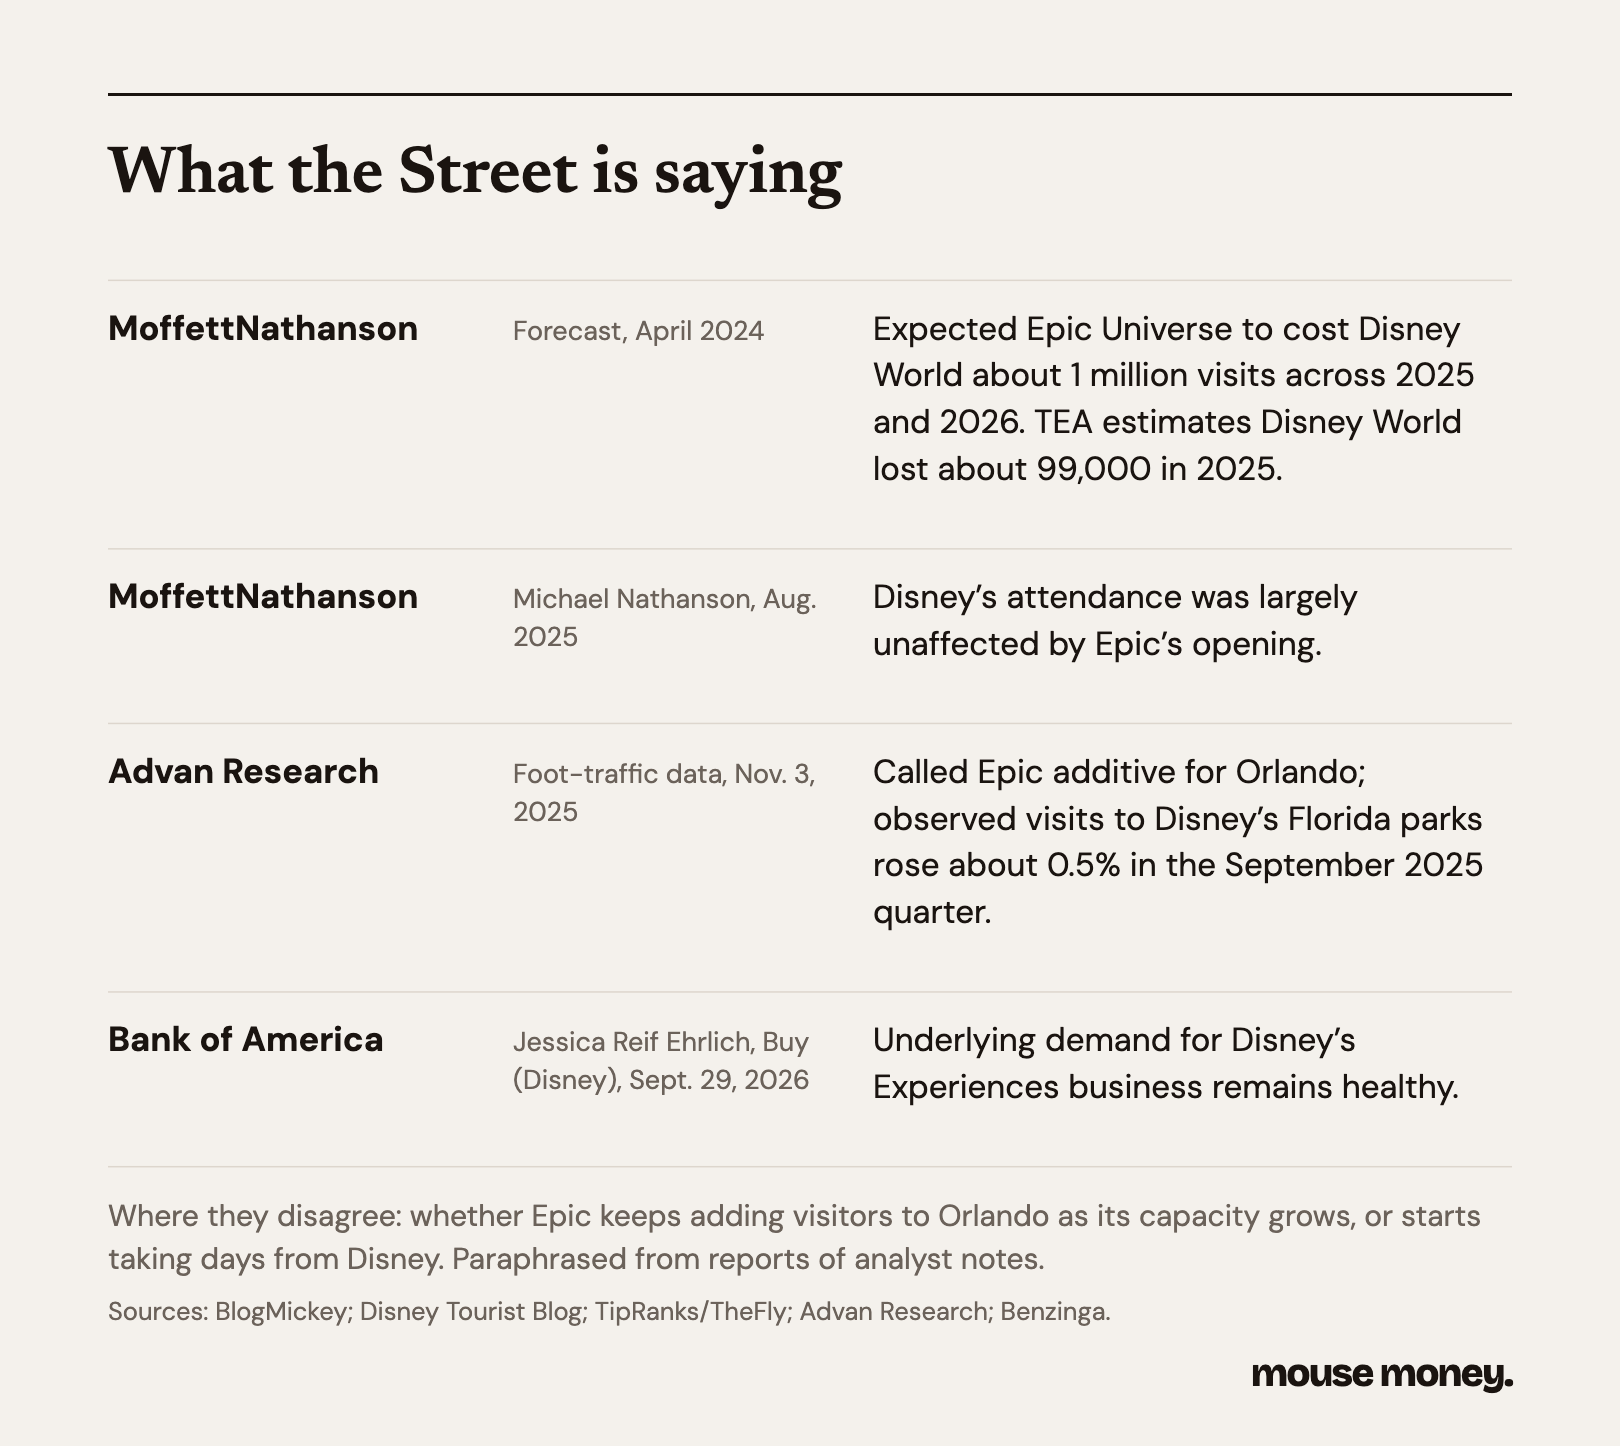
Chief Financial Officer Hugh Johnston said in November 2025 that Epic’s effect on Disney was “very much in line with our expectations” and suggested it was hurting other competitors more. TEA’s estimates suggest the parks most affected were Universal’s own: Universal Studios Florida and Islands of Adventure fell 2.4% combined, compared with 0.2% at Disney World and 0.3% at SeaWorld Orlando. Advan Research’s foot-traffic data pointed the other way: its November 2025 report showed visits to those two Universal parks above the prior year.
Universal’s gains showed up in Comcast’s results. Its theme parks segment, which also includes Hollywood, Japan and Beijing, increased revenue 14.2% in 2025 to $9.84 billion, which Comcast attributed mainly to Epic. Adjusted earnings before interest, taxes, depreciation and amortization rose a smaller 4.5%, to $3.08 billion, as Epic’s operating costs grew, according to Comcast’s annual report.
The record before Epic
Shared growth is not new to Orlando. From 2015 to 2019, estimated attendance at Disney World’s four parks rose 8.8% to 58.8 million, and Universal’s two parks rose 15.9% to 21.3 million. Together they added about 7.7 million visits. Disney’s share of the two companies’ combined attendance fell by 1.2 percentage points over that period, while its own attendance rose by about 4.7 million.
Universal’s previous big openings tell a similar, if uneven, story. In 2010, when the Wizarding World of Harry Potter opened at Islands of Adventure, that park’s attendance rose 30.2%; three of Disney’s four parks declined and Animal Kingdom grew, leaving Disney World down 0.9%. In 2014, when Diagon Alley opened at Universal Studios Florida, that park rose 17% and all four Disney parks grew, lifting Disney World 2.7%. In none of the three opening years did Disney World’s estimated attendance fall by more than 1%.
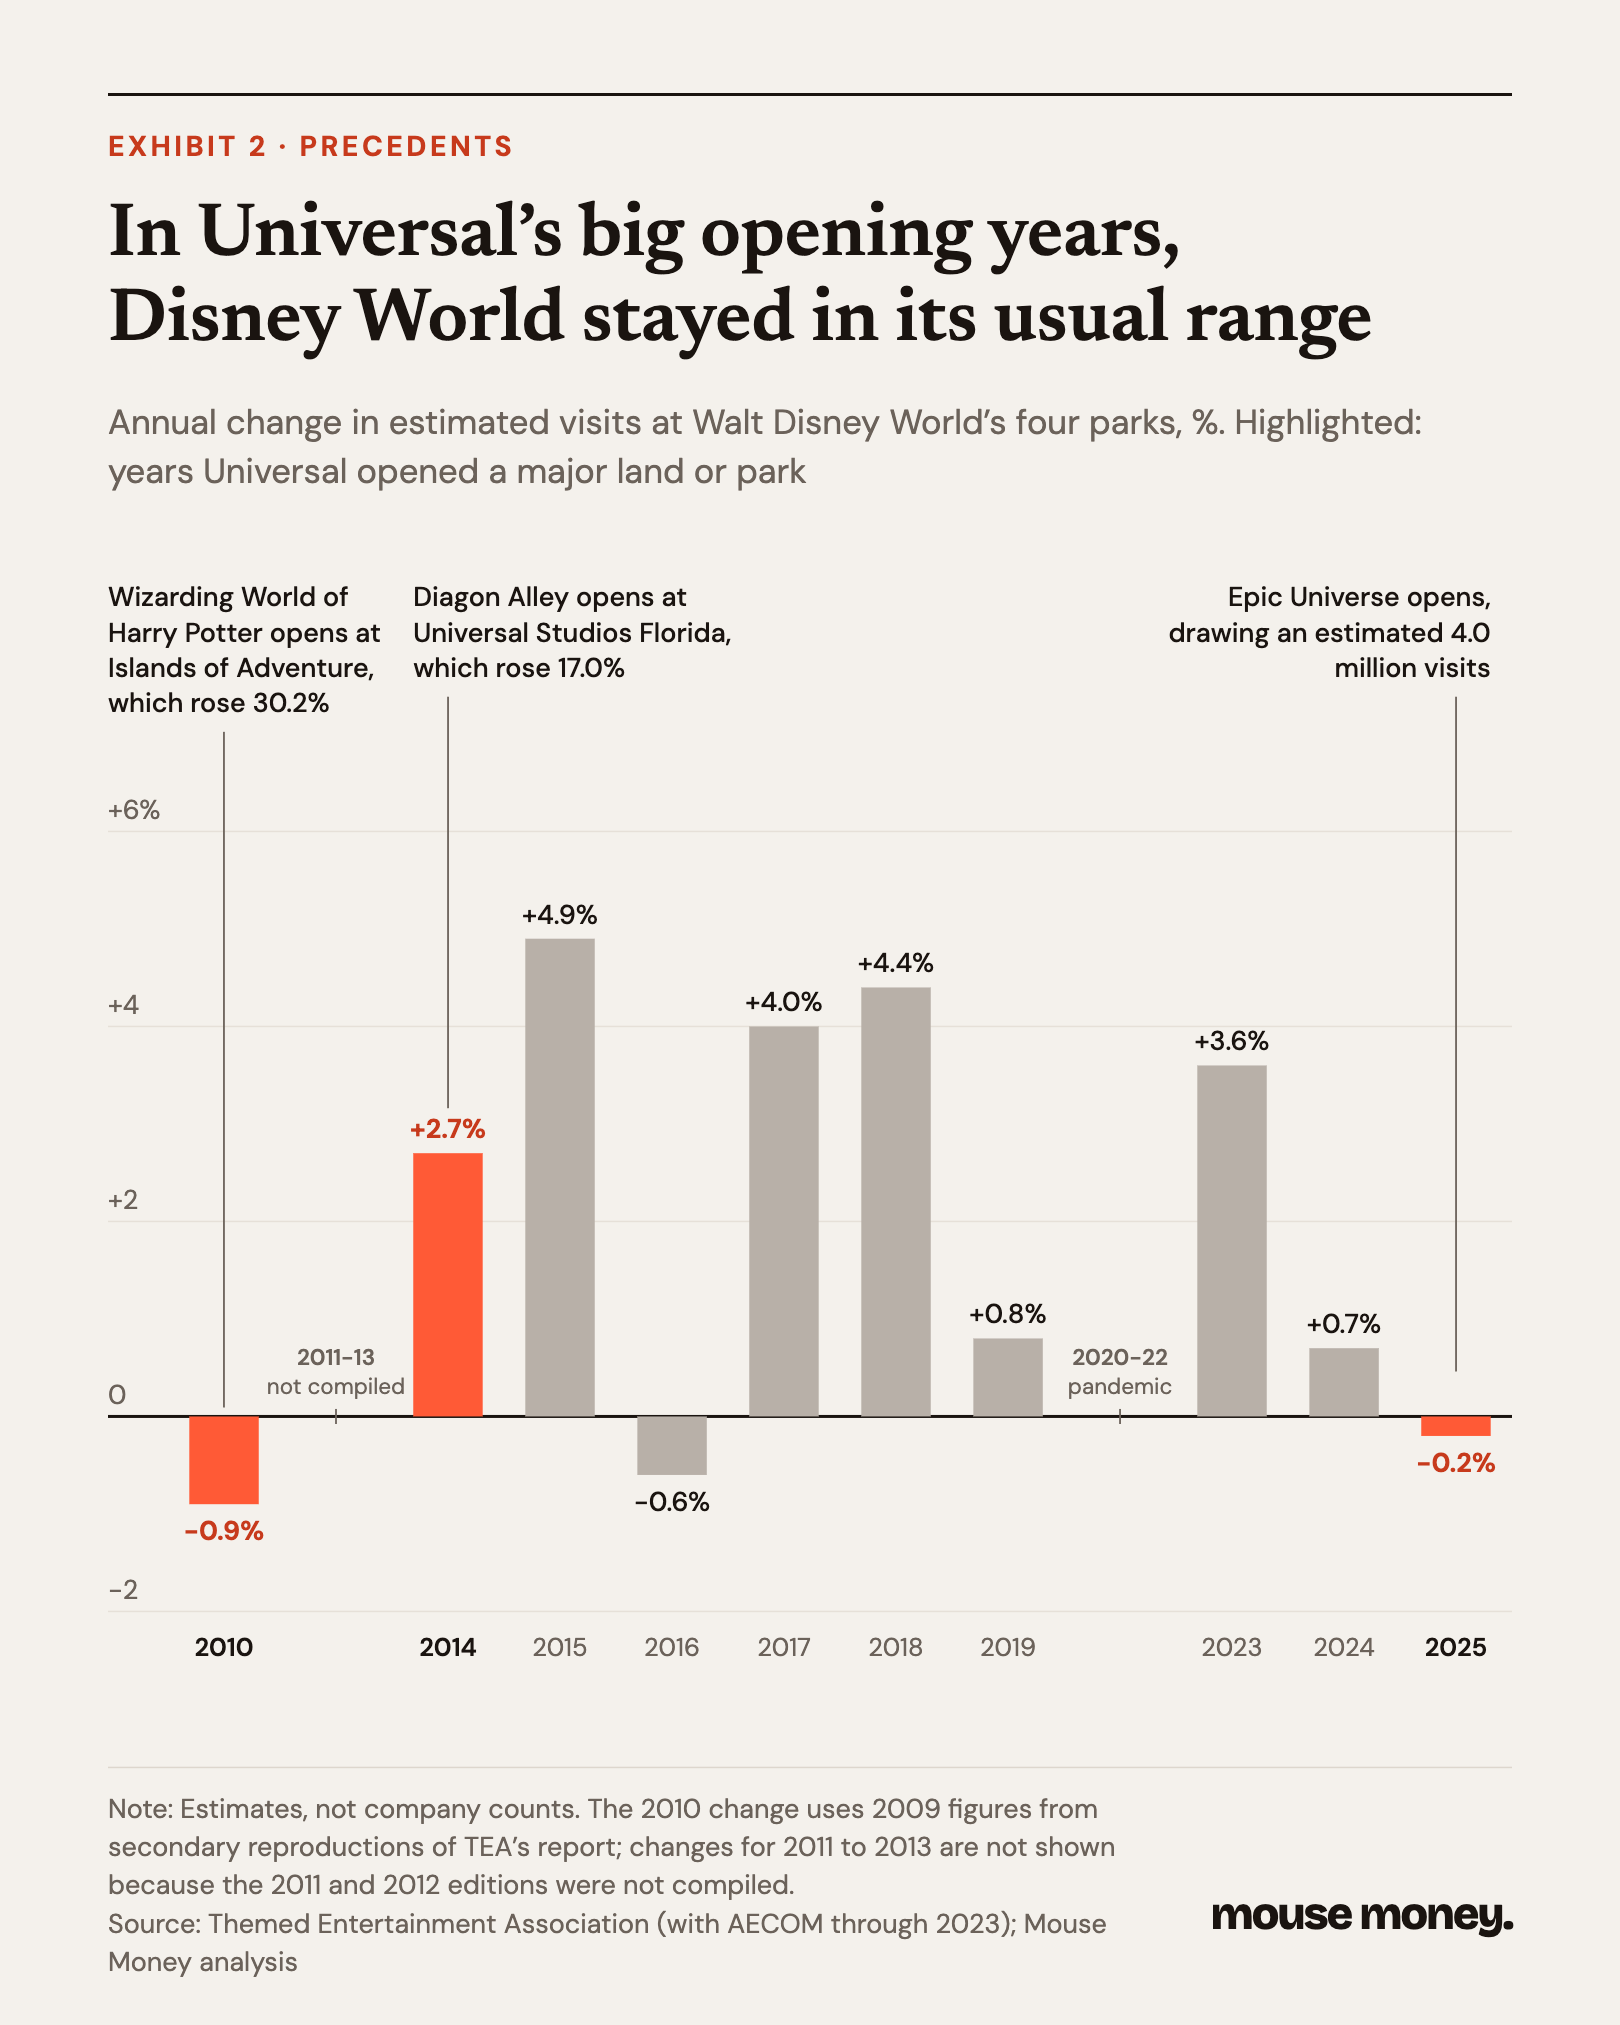
That history establishes that both resorts can grow at once. It does not show that one caused the other’s gains. A strong economy, rising air travel and each company’s own investments, such as Pandora at Animal Kingdom in 2017, could lift both.
A scoreboard with a blind spot
The longer comparison raises a different question. TEA’s estimates put Disney World’s 2025 attendance 16.6% below 2019, and the two companies’ combined total 10.7% lower, even with a new park. More than half of Disney’s estimated shortfall sits at Animal Kingdom, which TEA puts at 8.8 million visits, compared with 13.9 million in 2019.
The other gauges we examined tell a different story. Visit Orlando, the region’s tourism agency, counted a record 76.7 million visitors in 2025, about 1% more than the 75.8 million it counted in 2019. Metro Orlando’s hotels sold about as many room nights in the first nine months of 2025 as in the same period of 2019, according to STR data in Visit Orlando’s quarterly reports. In 2023, STR changed how it estimates figures for hotels that do not report data, so the two years may not be strictly comparable. Orlando International Airport handled 57.7 million passengers, 14% more. Disney’s own U.S. hotels filled about 1% fewer room nights in fiscal 2025 than in fiscal 2019, based on the occupancy and available room nights in its annual reports.
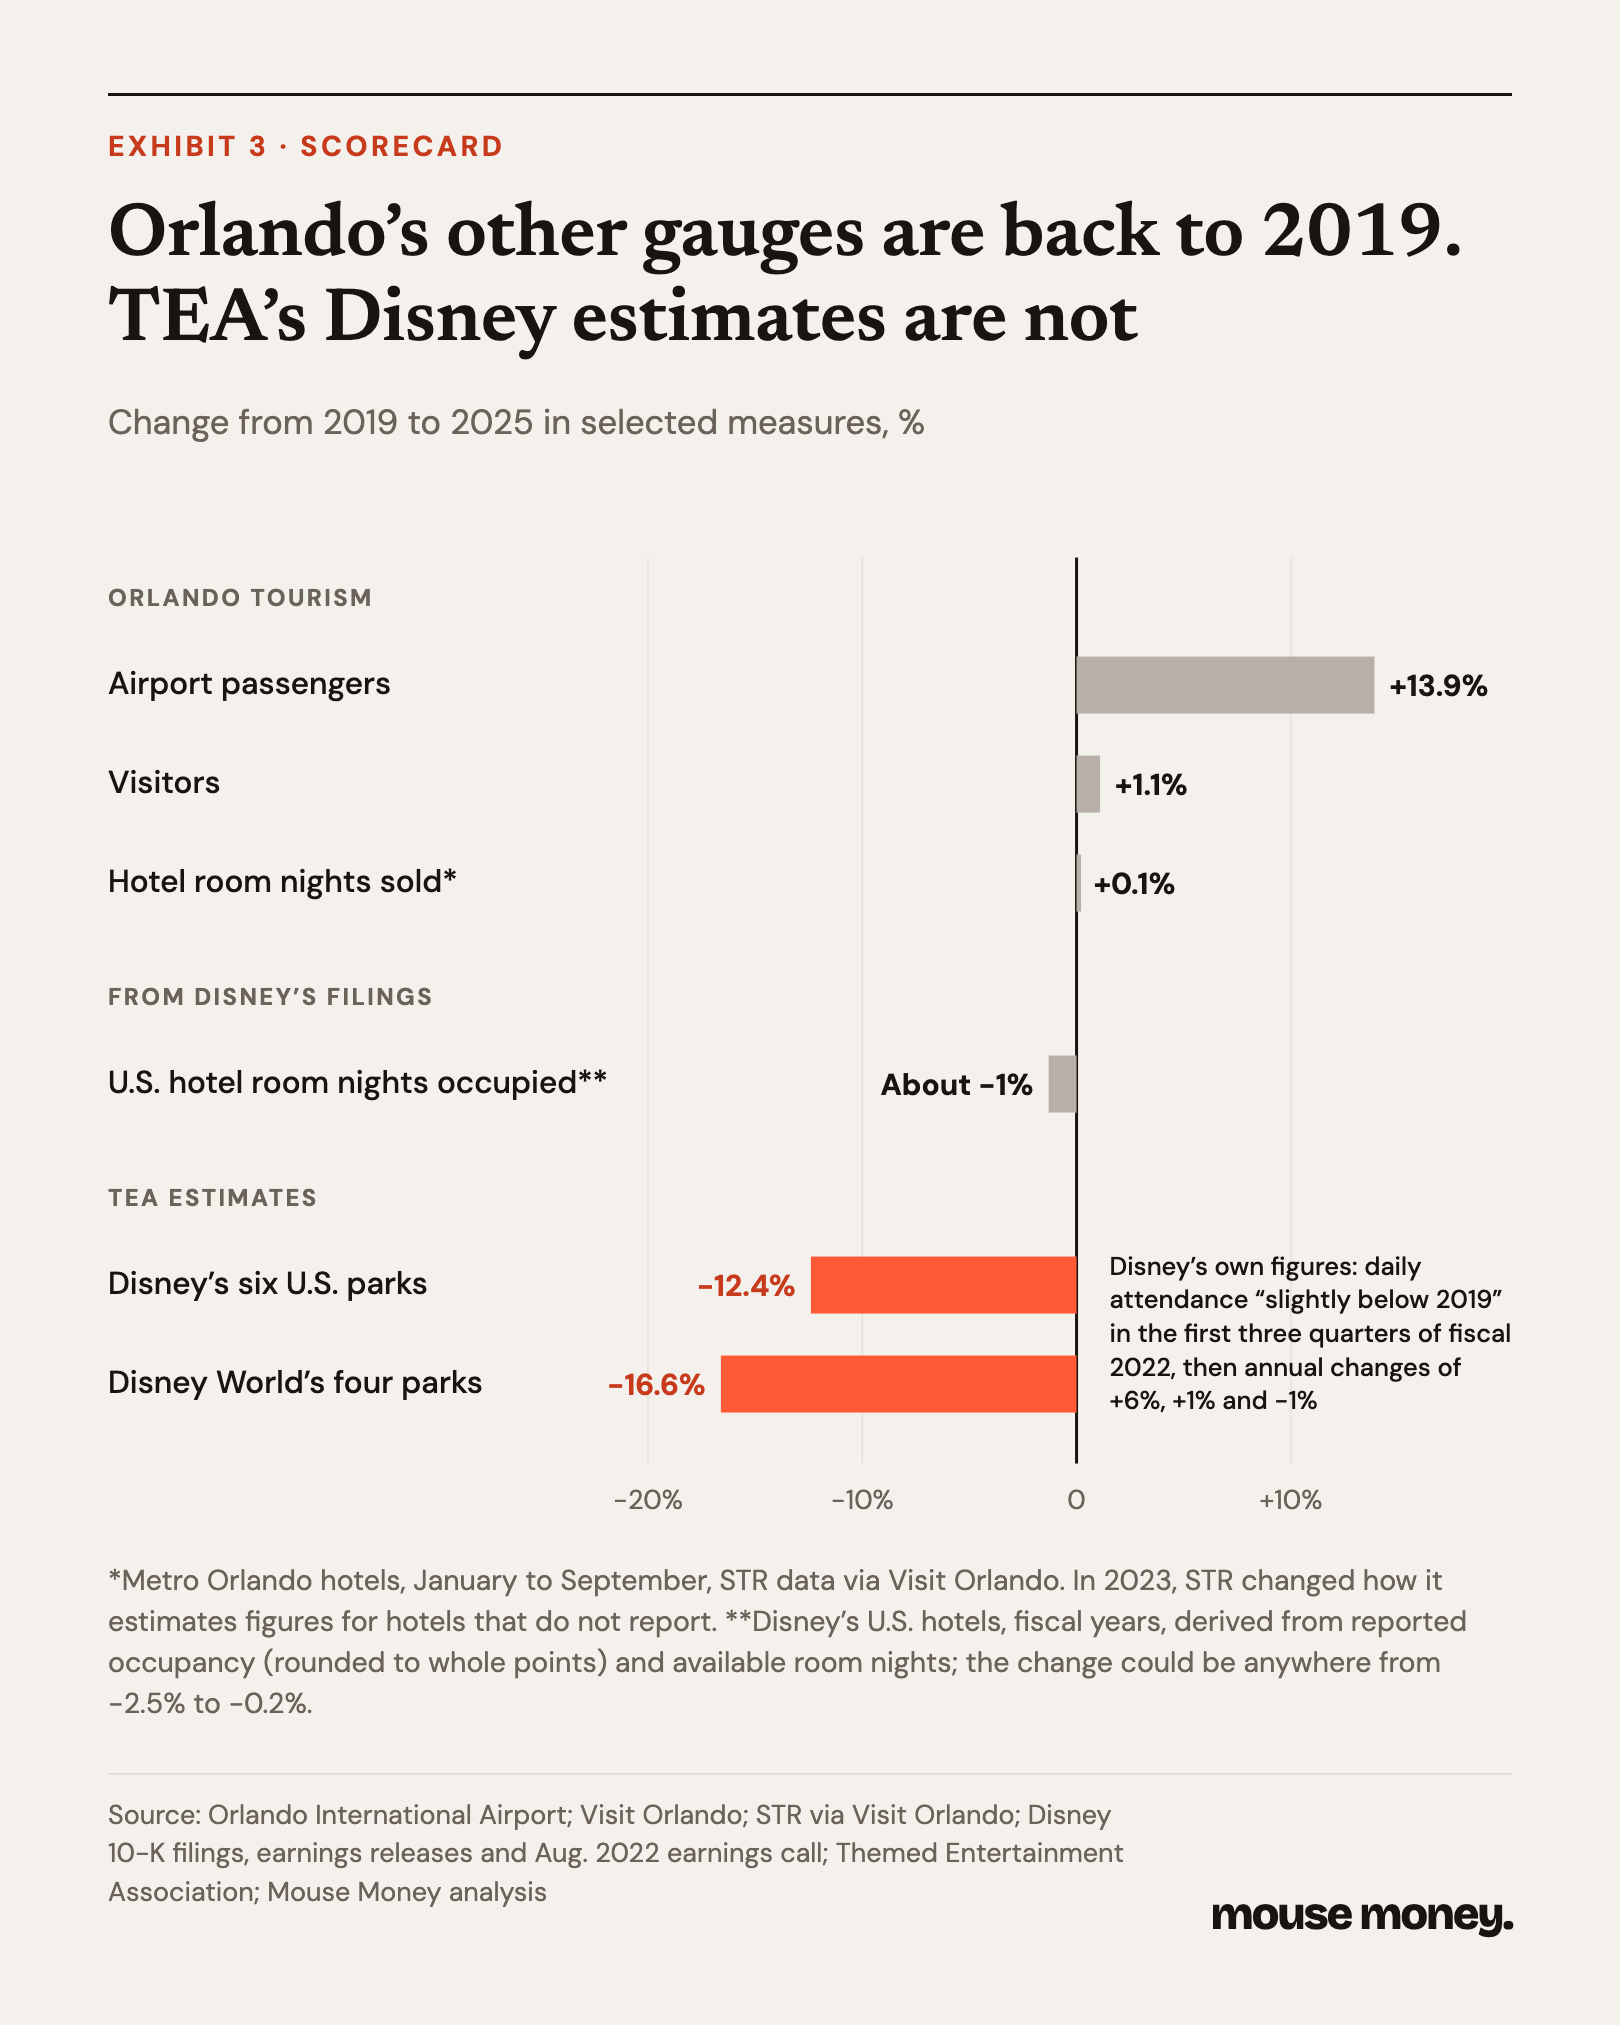
Disney’s attendance disclosures support those gauges more than they support the estimates. Disney does not publish attendance counts for its parks, but it reports the annual change at its U.S. parks, Disney World and Disneyland combined. In August 2022, then-CFO Christine McCarthy said average daily attendance at those parks over the first three quarters of that fiscal year was “slightly below 2019.” Since then, Disney has reported increases of 6% and 1% and a decline of 1%. Chained together, those figures put Disney’s U.S. parks within a few percent of their 2019 attendance. Disney has not said so, and the starting point is a qualitative remark about months when the company was limiting entry through reservations. TEA’s estimates for the same six parks were 16.5% below 2019 in 2022 and remain 12.4% below.
The two measures have moved roughly in step since 2022: Disney reported growth of about 6% over those three years, and TEA’s estimates rose about 5%. The gap opened during the pandemic and has not closed.
There are reasonable explanations, and they do not all point the same way. Disney counts each guest once a day, however many parks they visit; TEA counts park visits. Disney limited park hopping to afternoons from 2021 until January 2024, which would have reduced park visits relative to Disney’s count, though the gap has persisted since the restriction ended. Disney’s figures also include Disneyland, and its fiscal year ends around Sept. 30.
TEA’s figures are estimates. The association builds them from operator information, financial reports, tourism data, mobile location analytics and professional judgment, according to Attractions Magazine’s account of the report. Its 2025 edition shows the same 0.2% decline at each of Disney World’s four parks and the same 0.4% increase at both Disneyland parks, a pattern consistent with a resort-wide estimate applied park by park. When each year’s estimate builds on the last, an error introduced in an unusual year can persist.
None of this proves the estimates wrong. Visitors could be spending fewer of their days in theme parks than they did in 2019, for example. But the finding that Disney World is still about 17% below its pre-pandemic attendance comes from a single estimate. None of the other measures we examined corroborates it, though none of them counts park visits directly.
Where the money comes from
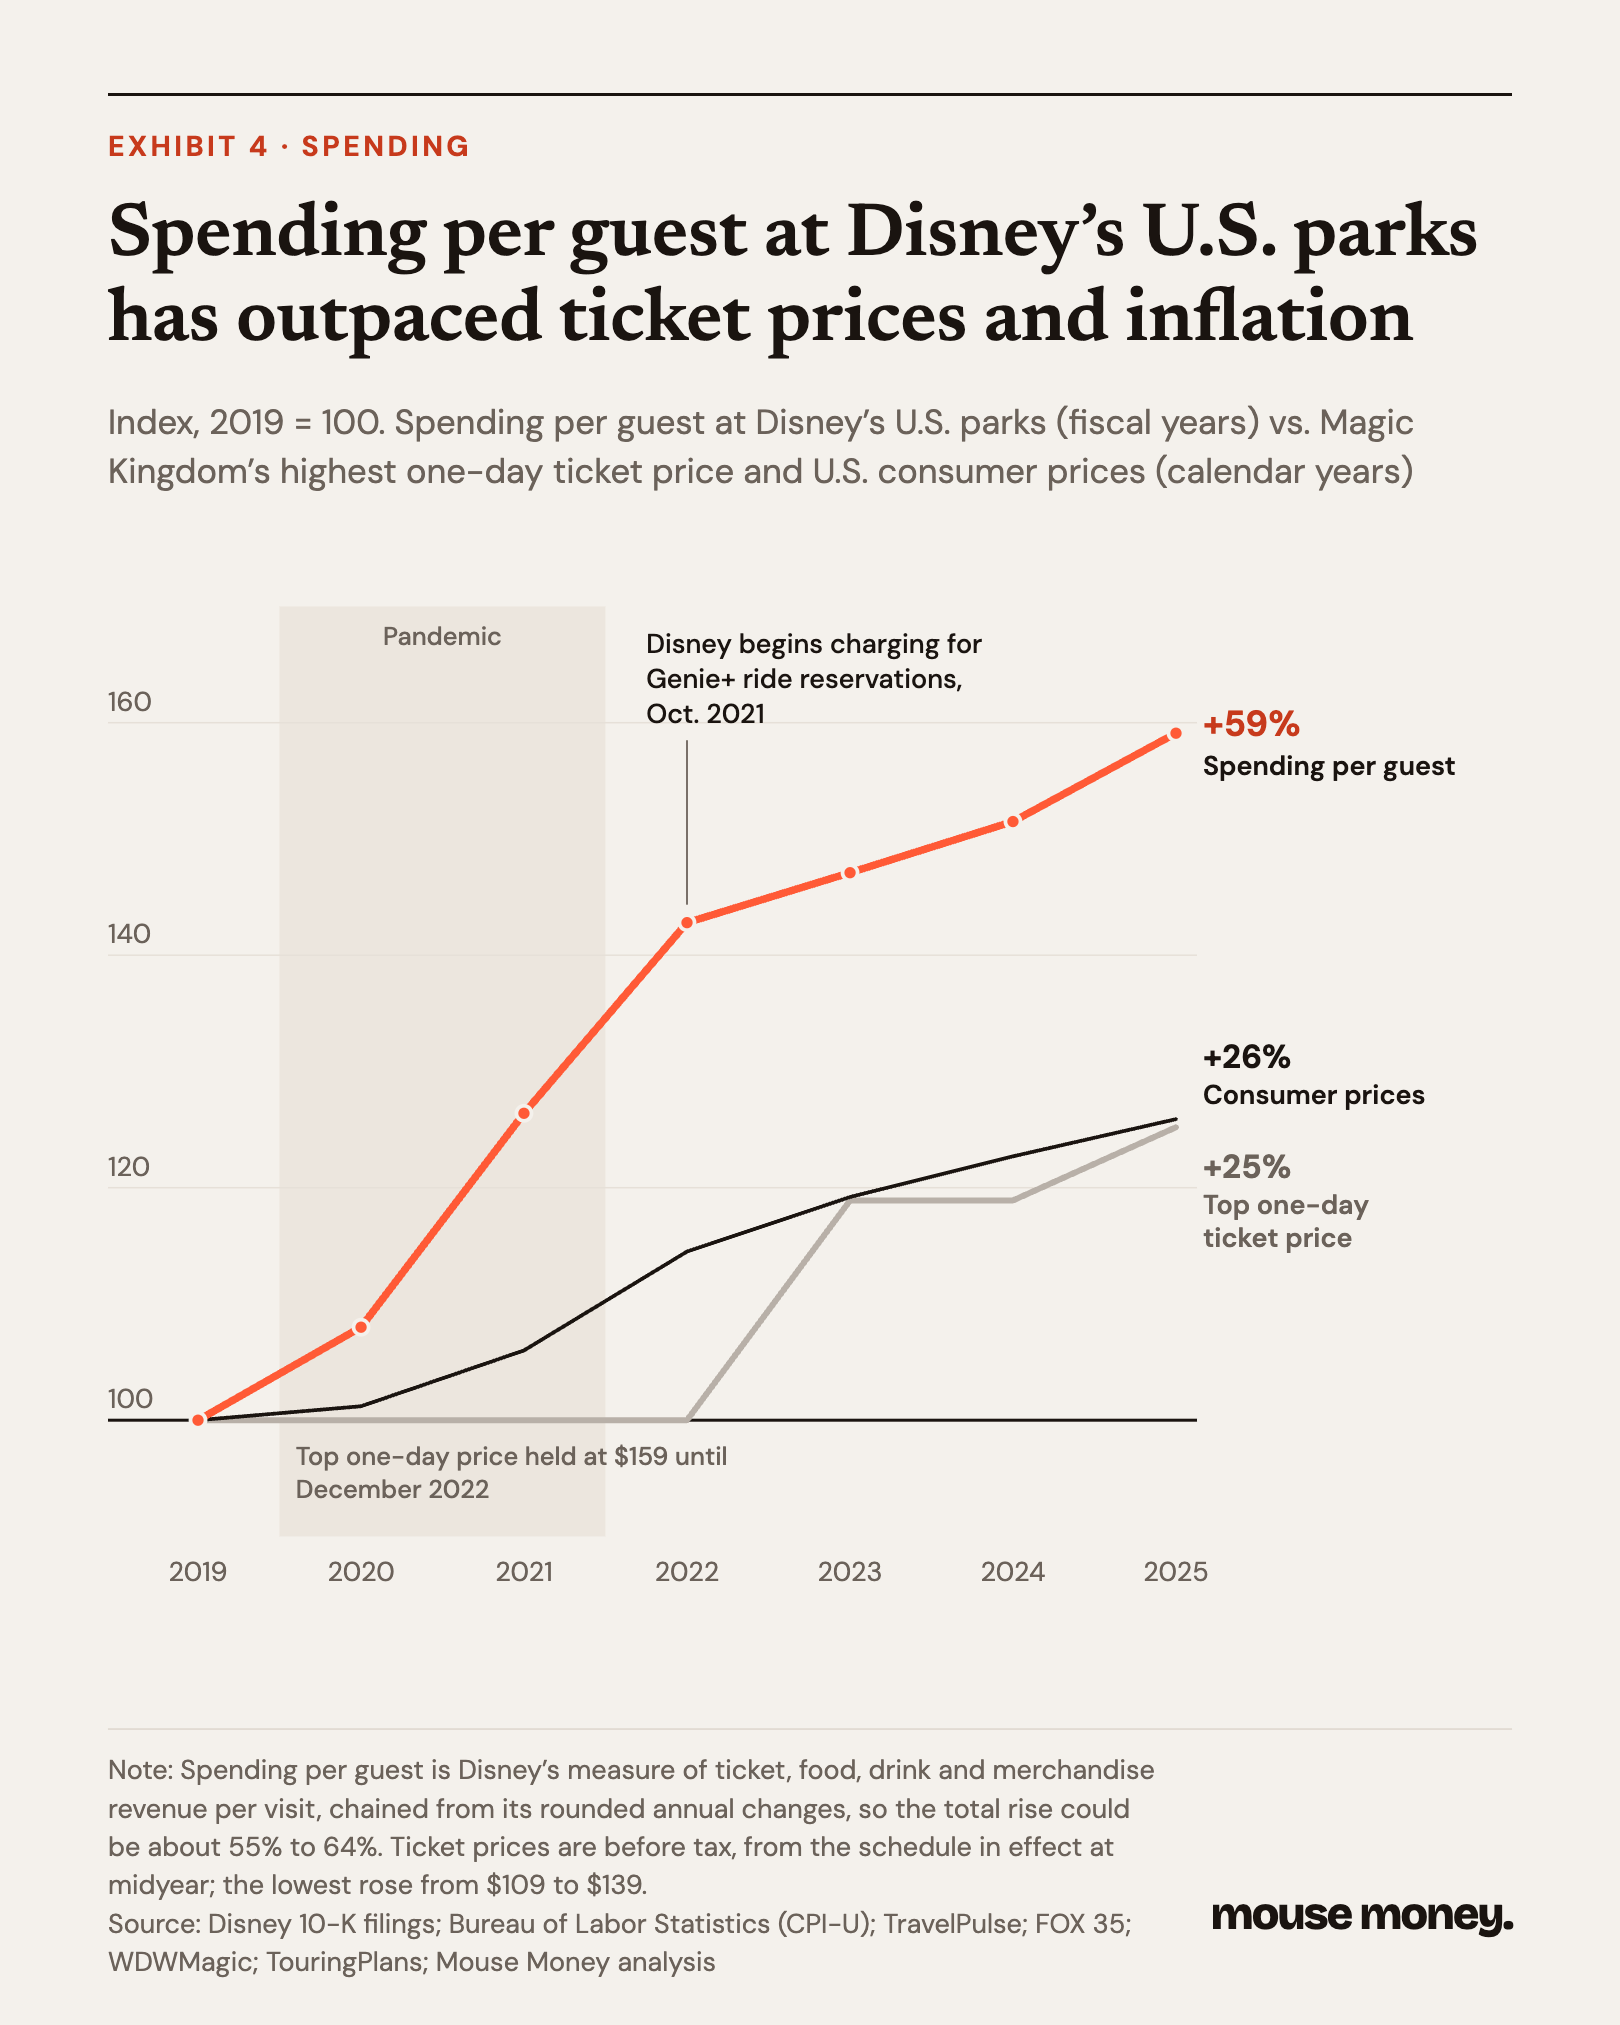
What the companies do report clearly is how much more each guest spends. Disney’s spending per guest at its U.S. parks, which covers tickets, paid Lightning Lane access, food, drinks and merchandise, has risen about 59% since fiscal 2019, based on the annual changes in its 10-K filings. Consumer prices rose about 26% over the same period, according to the Bureau of Labor Statistics.
Published one-day prices rose far more slowly than spending per guest. Magic Kingdom’s highest one-day price rose from $159 in 2019 to $199 in 2025, and its lowest from $109 to $139, gains of 25% and 28%, roughly in line with inflation. The difference reflects what guests buy beyond a basic one-day ticket, including paid ride access, food and merchandise, and which dates and tickets they choose.
Disney’s U.S. parks and experiences business, which also includes its cruise line and vacation club, increased revenue 45% from fiscal 2019 to fiscal 2025, to $25.2 billion, and operating income 44%, to $6.4 billion. Orange County’s tourist development tax, a 6% levy on hotel and short-term rental stays, brought in a record $384.6 million in the year ended Sept. 30, 2025, about 35% more than in fiscal 2019, while the metro area’s hotels sold about the same number of room nights.
That is the economic logic beneath the shared growth. Disney has grown by earning more from each visit, with attendance that its own disclosures suggest is near its 2019 level. Universal has grown by adding capacity.
Room for a longer stay
Universal has more than doubled its Orlando hotel inventory in a decade, from about 4,200 rooms in 2015 to about 11,000 in 2025, including three hotels that opened alongside Epic. Disney’s on-site inventory at Disney World has barely changed, at about 23,000 hotel rooms plus some 3,900 vacation-club units. Universal now holds about 29% of the two companies’ on-site rooms, up from 14%.
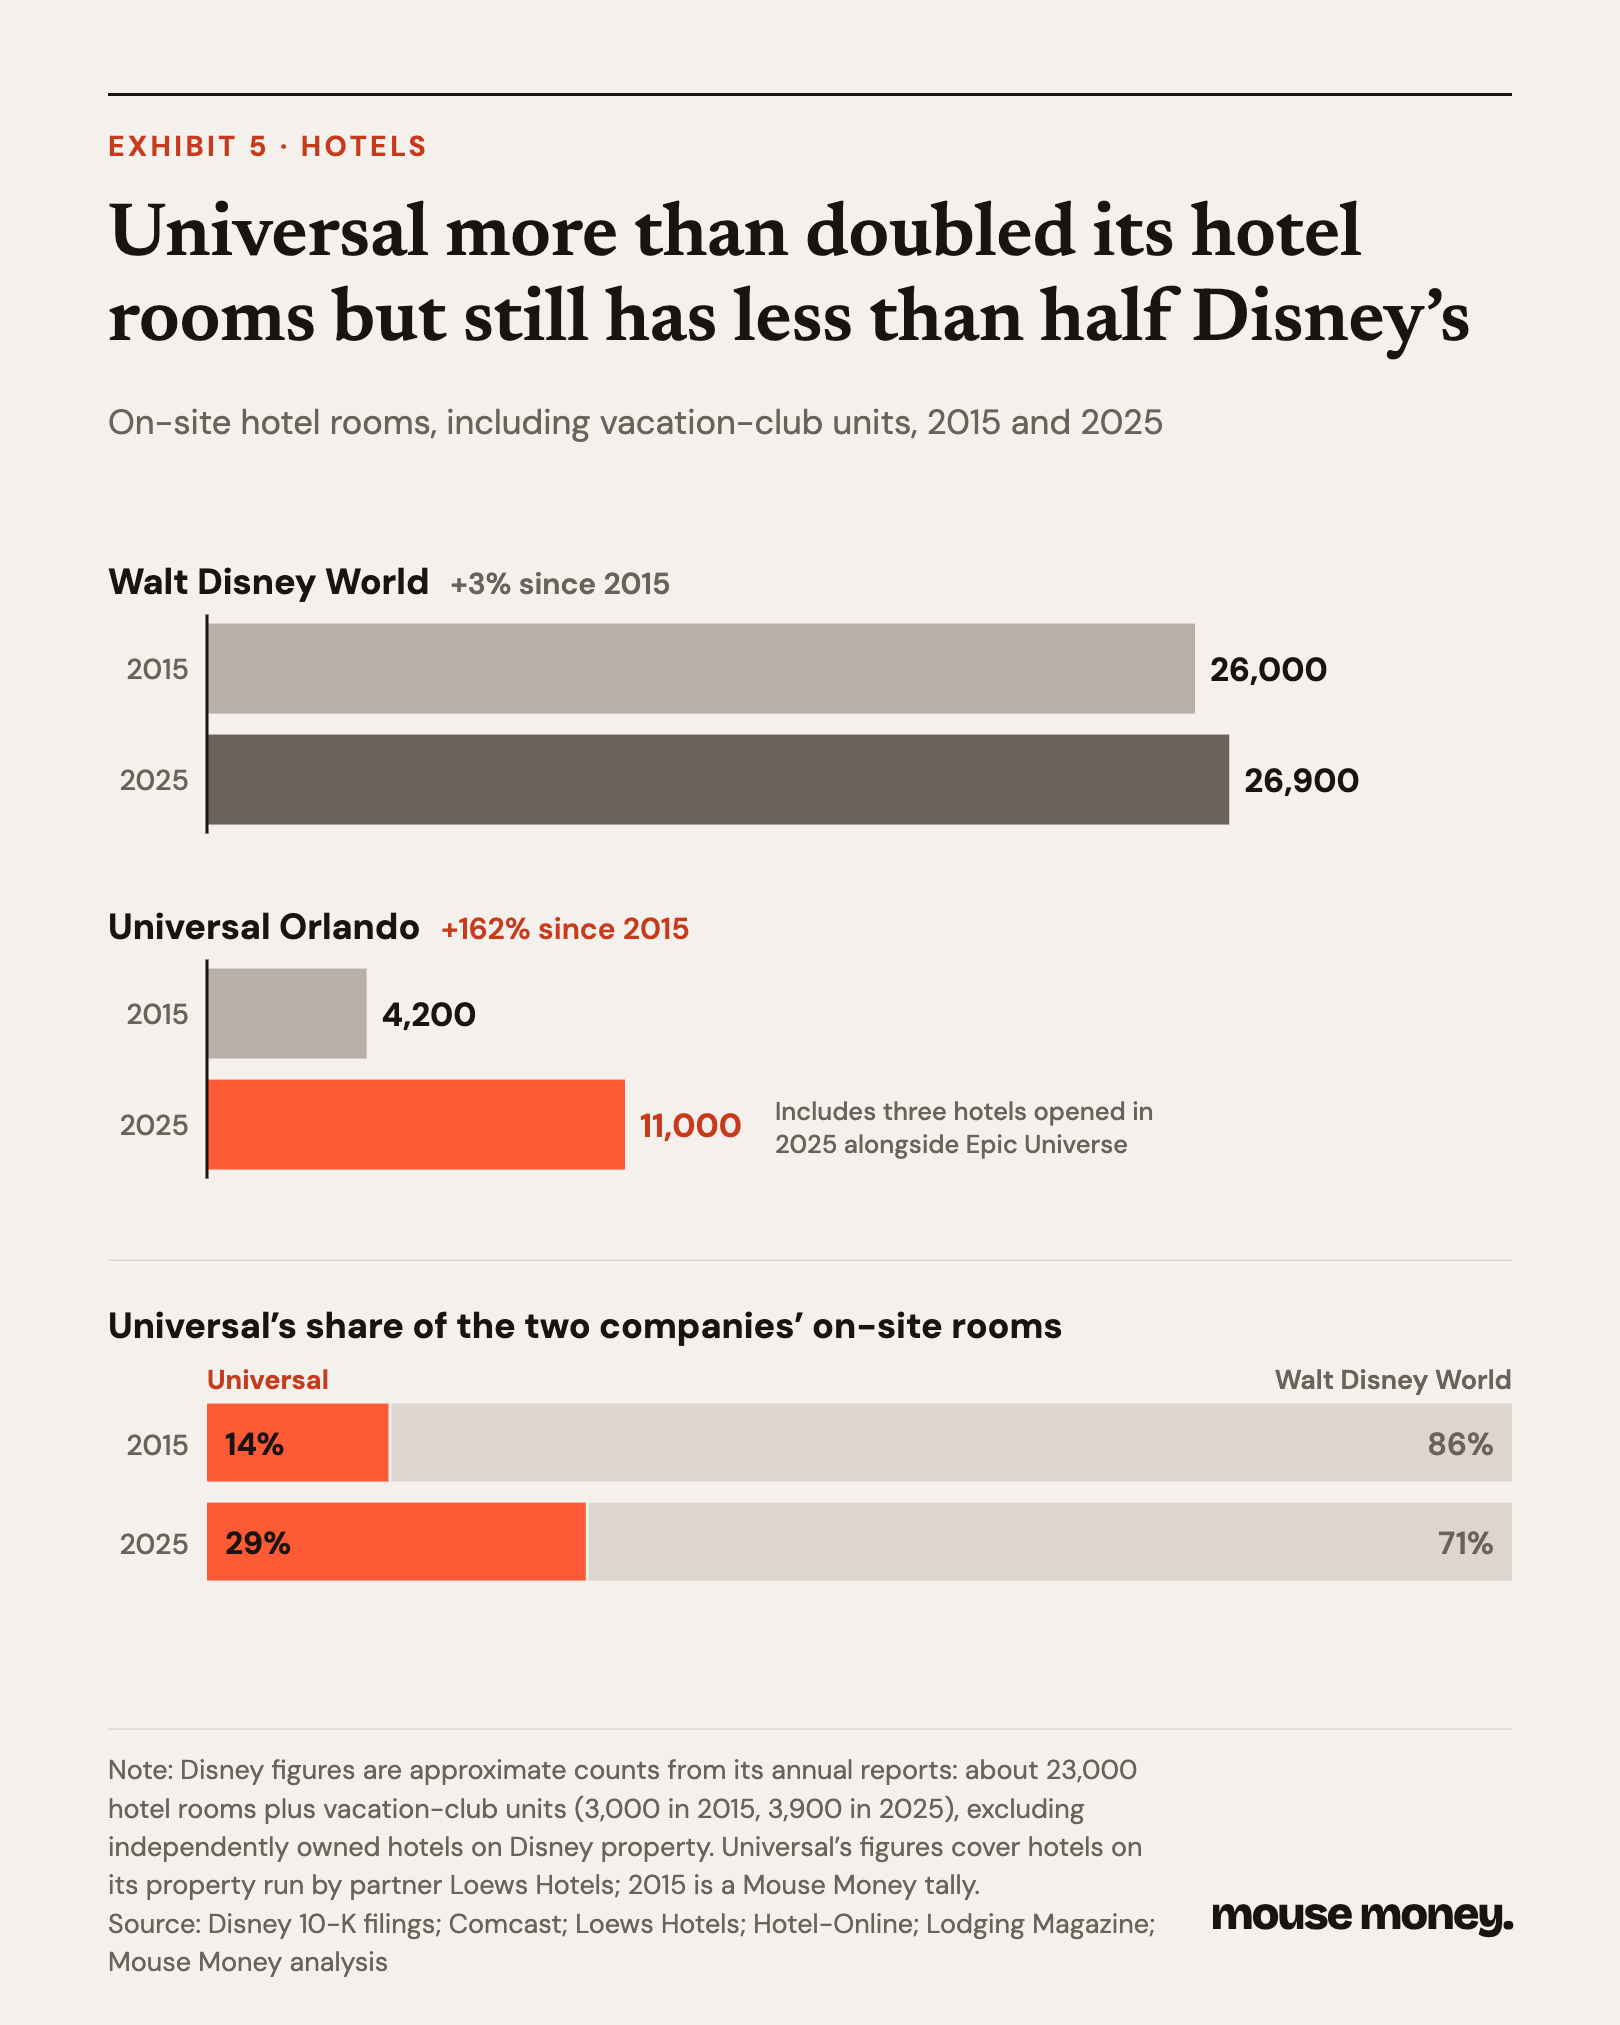
Rooms are what turn a day trip into a week. Universal’s three-park tickets and hotel perks are built to keep a family at Universal for several days, and that is where the two companies can still collide. A family with a fixed budget that adds an Epic day may drop a Disney day; a family that extends its trip creates spending for both. Annual totals cannot show which happened. Disney’s steady attendance suggests most of Epic’s visits did not come out of Disney’s parks, while Universal’s older parks gave up about 450,000.
What would change our view
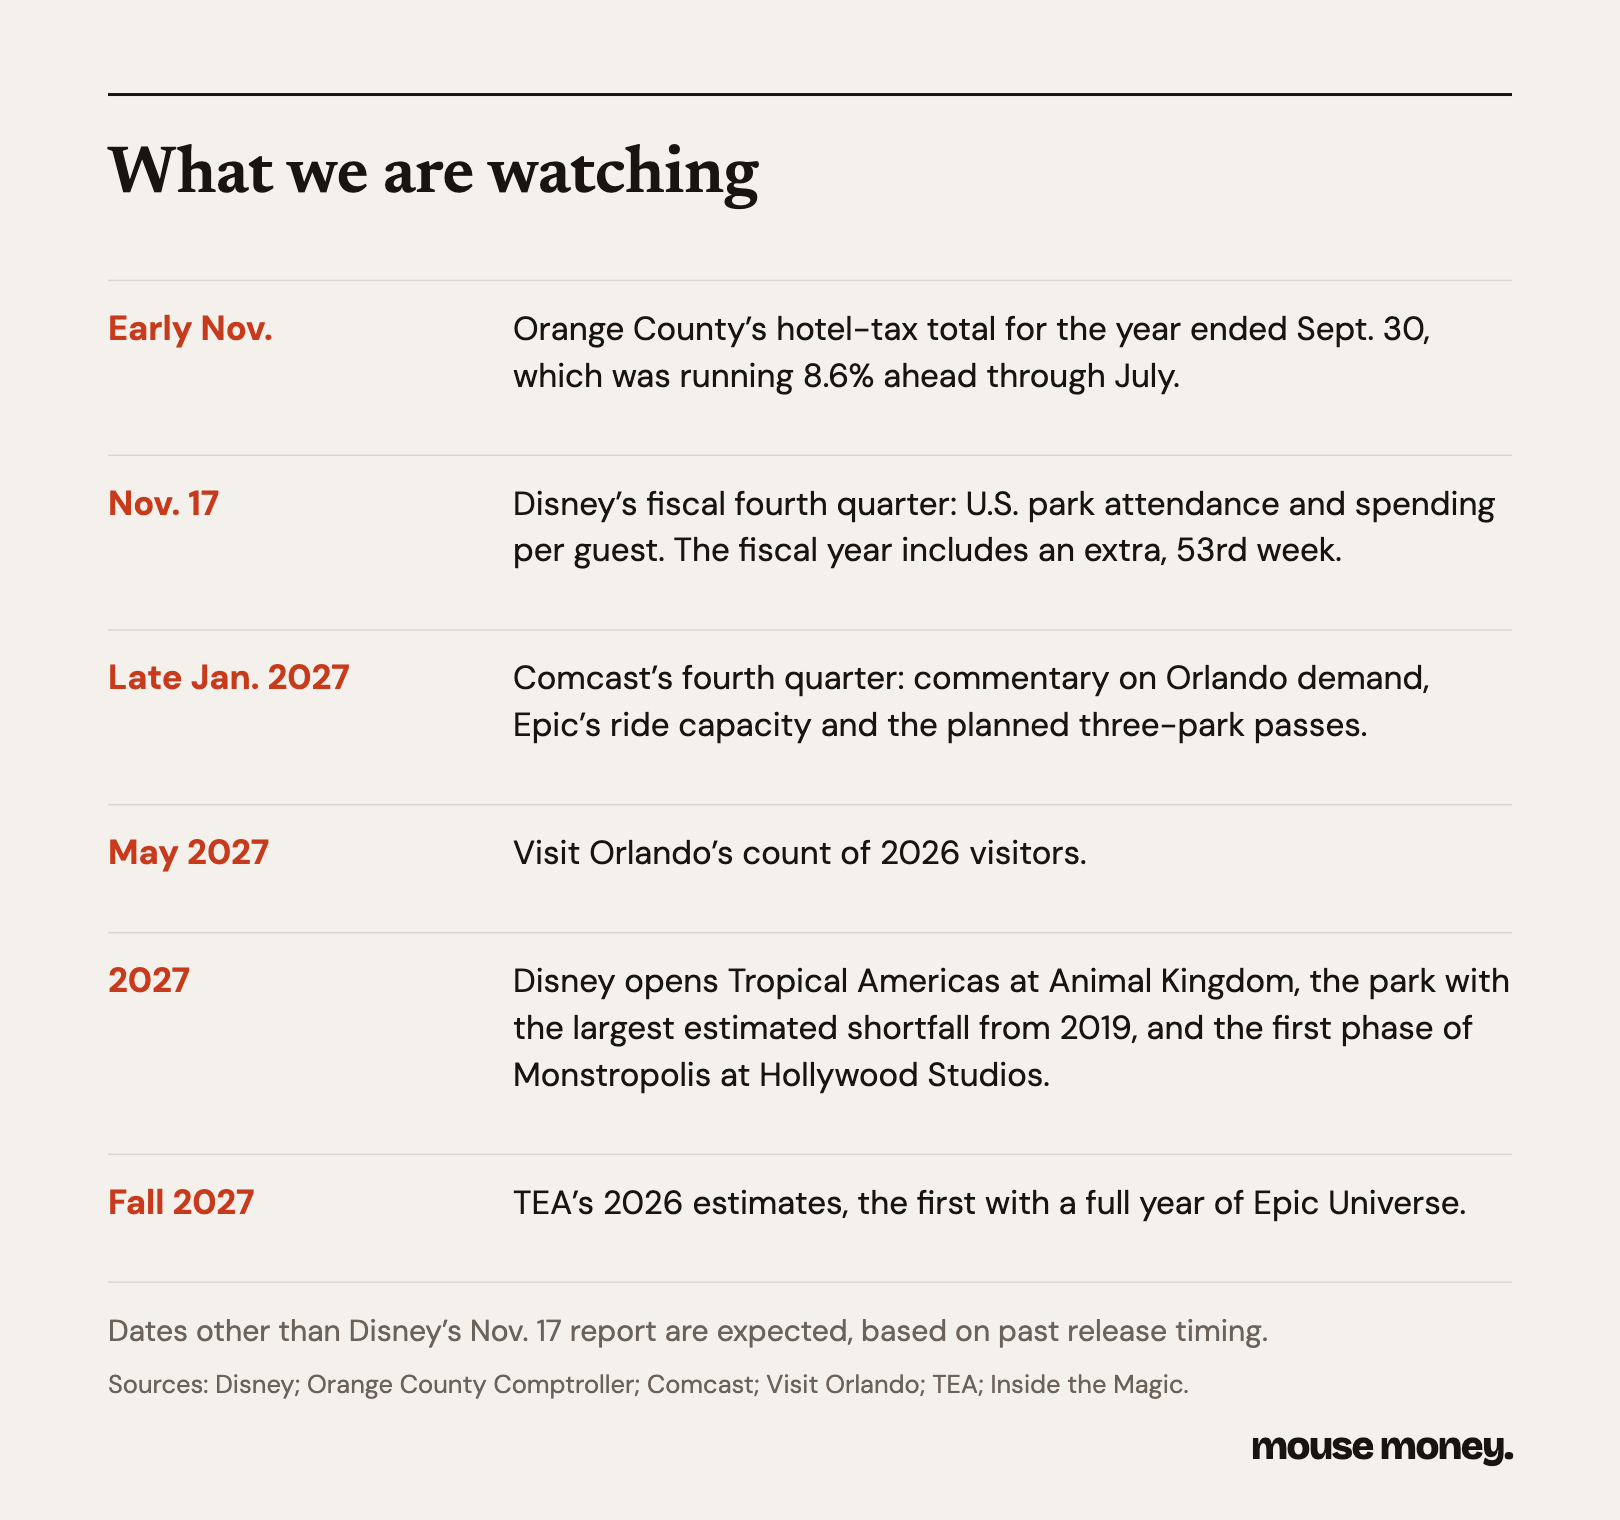
Epic’s first year was a partial one, and Universal’s momentum has slowed since: its parks revenue fell 4.4% in the quarter ended Sept. 30, 2026, and Comcast co-Chief Executive Mike Cavanagh said competitors adapted their marketing faster to softer demand. Disney’s report on Nov. 17 will cover the summer that Universal found weak. TEA may also revise its approach, and the gap between its estimates and Disney’s disclosures could narrow from either direction.
If Disney’s reported U.S. attendance and TEA’s 2026 estimates both show Disney losing visits while Universal’s Orlando attendance grows, the case that this rivalry is not zero-sum is wrong.
How we did this
We compiled TEA’s estimates, produced with AECOM through 2023, for Orlando’s eight major theme parks, including Epic Universe, from each edition covering 2009, 2010 and 2013 through 2025, plus Disneyland and Disney California Adventure for 2019, 2022 and 2025, and found no later restatements of the figures we used. We compared them with Disney’s 10-K filings and earnings-call transcripts, Comcast’s filings, Visit Orlando’s visitor estimates and the STR hotel data it reports, Orlando International Airport’s traffic reports and Orange County’s tax collections. Growth rates and shares are Mouse Money calculations from the published figures.
Sources
Attractions Magazine, Oct 2026: 2025 theme park attendance, TEA index
Crowd Levels, Oct 2026: Disney and Universal theme park attendance, 2025
Attractions Magazine, May 2016: 2015 TEA/AECOM attendance report
Theme Park Insider, Jun 2015: 2014 TEA/AECOM attendance report
Disney Form 8-K, Apr 2021: recast segment results including fiscal 2019
Visit Orlando, May 2026: Record 76.7 million visitors in 2025
Florida Politics: Orlando hosted 74 million visitors in 2022 (2019 total of 75.8 million)
Visit Orlando Q3 2025 organizational highlights (STR hotel data)
CoStar: Methodology changes lift historic Orlando hotel figures
Greater Orlando Aviation Authority: MCO fact sheet, 2013-2025 passengers
Orange County Comptroller: September 2025 tourist development tax report
FOX 35, Nov 2025: Orange County tourist tax revenue hits new record
Orange County, Sep 2022: Prior record tourist development tax collections
TravelPulse, Mar 2019: Walt Disney World raises ticket prices
WDWMagic, Oct 2024: Walt Disney World ticket prices for 2025
TouringPlans: Disney World one-day ticket prices for 2025, as of Nov. 17, 2024
FOX 35, Oct 2022: Disney World raises ticket prices for the first time in three years
Hotel-Online, Jul 2016: Loews Sapphire Falls Resort opens at Universal Orlando
Lodging Magazine, Apr 2025: Universal Helios Grand Hotel opens
Attractions Magazine: Disney’s CFO and Epic Universe’s impact, fact-checked against past openings
BlogMickey, Apr 2024: MoffettNathanson on Epic Universe and Disney World
Disney Tourist Blog: MoffettNathanson’s Epic Universe attendance estimate
TipRanks/TheFly, Aug 2025: What Wall Street is saying about Disney
Advan Research, Nov 2025: Epic Universe grew the theme park universe in ’25
Benzinga, Sep 2026: Bank of America on Disney’s fourth quarter
ClickOrlando, Sep 2026: Orange County tourist tax collections through July