


I thought Disney was a parks company
I have been going to Walt Disney World almost every year since 1982. For most of my childhood, Disney was a place: the castle, the monorail, the walk down Main Street. If you had asked me what business Disney was in, I would have said theme parks.
That changed in my first strategy course at Wharton, where Disney showed up again and again in the case studies. One was about governance. Michael Eisner’s board included Reveta Bowers, head of the school his sons attended, and Father Leo O’Donovan, the Jesuit president of Georgetown. BusinessWeek named it the worst board in America in 1997.
Another was about the companies that tried to copy Disney. The clearest example came later, in China. Wang Jianlin, then China’s richest man, promised his Wanda theme parks would surround Shanghai Disneyland like “a pack of wolves.” A year after Shanghai opened, Wanda sold 91% of its 13 tourism projects to Sunac and 77 hotels to R&F. Debt and regulators drove that sale. My read is that Wanda also ran into what Disney already knew: the rides are the easy part to build. The reason to come back is the stories.
The little green army men
The example I remember from class is the green army men from Toy Story, the plastic soldiers who run recon with a baby monitor. They are on screen for minutes, and they still march through Toy Story Land at Hollywood Studios. But they were never Disney’s. They are a 1930s toy anyone can make, and Toy Story revived a whole shelf of toys Disney did not own: sales of Mr. Potato Head and Etch A Sketch soared.
What Disney did own paid off. Merchandise from the first two Toy Story films reached $4 billion in retail sales by 2010. For fiscal 2010, Disney projected $2.4 billion of Toy Story merchandise sales at retail, and analysts estimated that could bring Disney more than $200 million in licensing revenue. That is the loop in Disney’s 1957 synergy map: films at the center, feeding television, Disneyland, music, books and merchandise. At Disney, one side has never worked without the other.
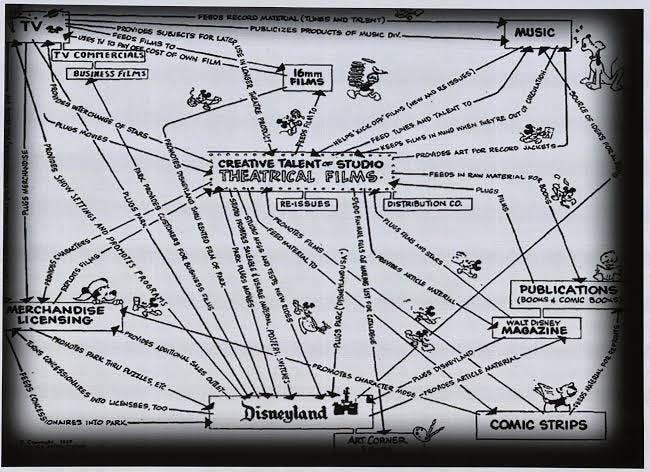
Disney’s 1957 synergy map. © Walt Disney Productions.
The question
Disney’s streaming business now earns an operating profit. But that milestone answers only one question. The larger one is how Disney divides its cash among recovering from the streaming build, expanding Experiences, rewarding shareholders and reducing debt, and how much room is left if the parks slow down.
Four CEOs and the deals they left behind
Disney’s last four CEOs came from two sides of the house. Eisner and Iger came up through television and film. Chapek and D’Amaro came up through consumer products and the parks.
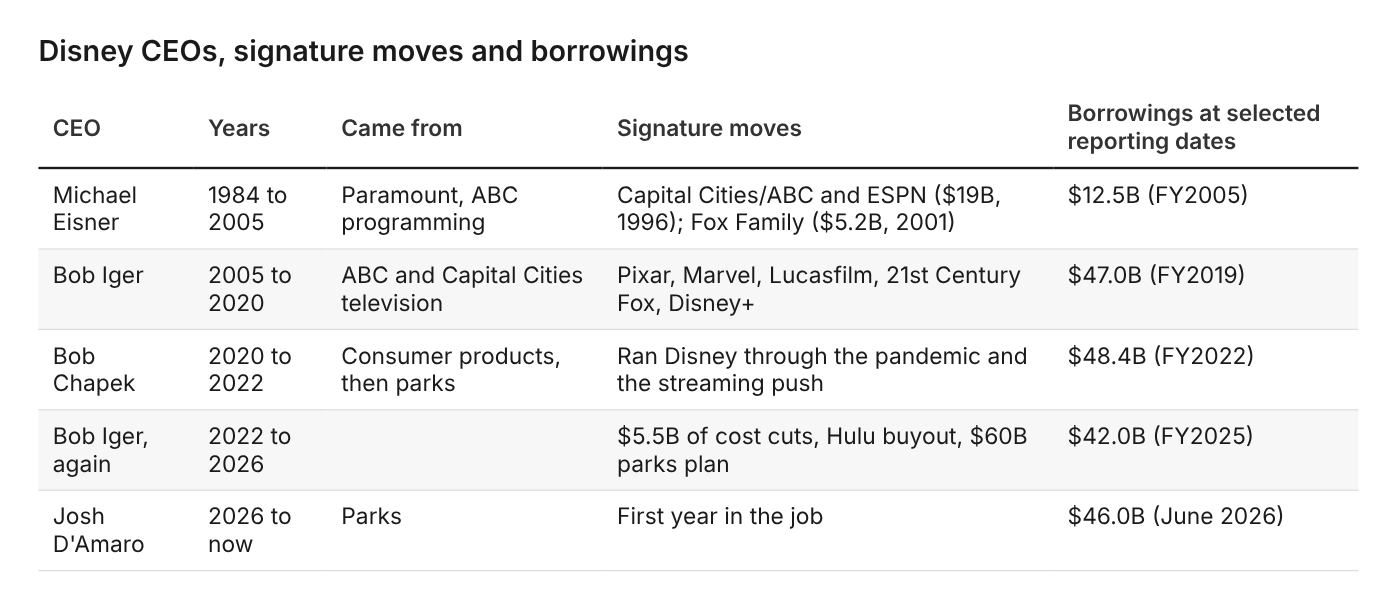
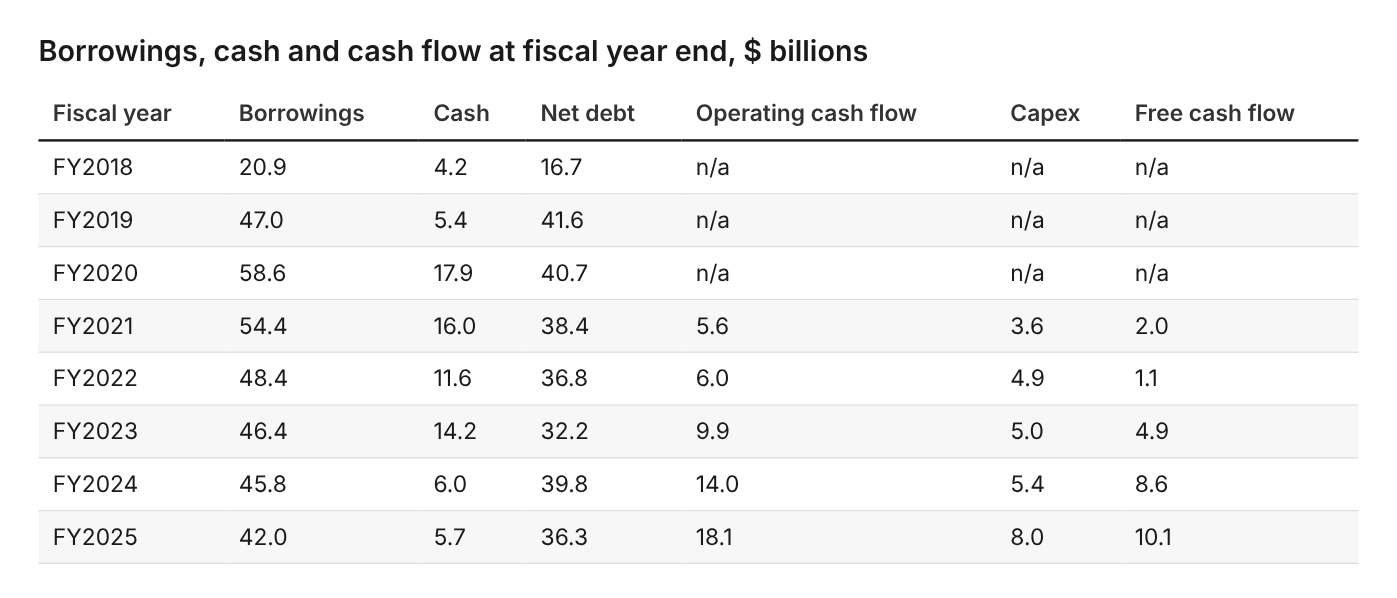
The résumés are a useful lens, but they do not explain the balance sheet on their own. The dates in the table are fiscal year ends near each handover, except D’Amaro’s, which is the latest quarter. Borrowings peaked at $58.6B in FY2020, Chapek’s first year, as Disney borrowed through the pandemic, then fell to $48.4B by FY2022. They fell again during Iger’s return and rose this year. The clearer pattern is in how the big content deals were paid for, and what each successor inherited.
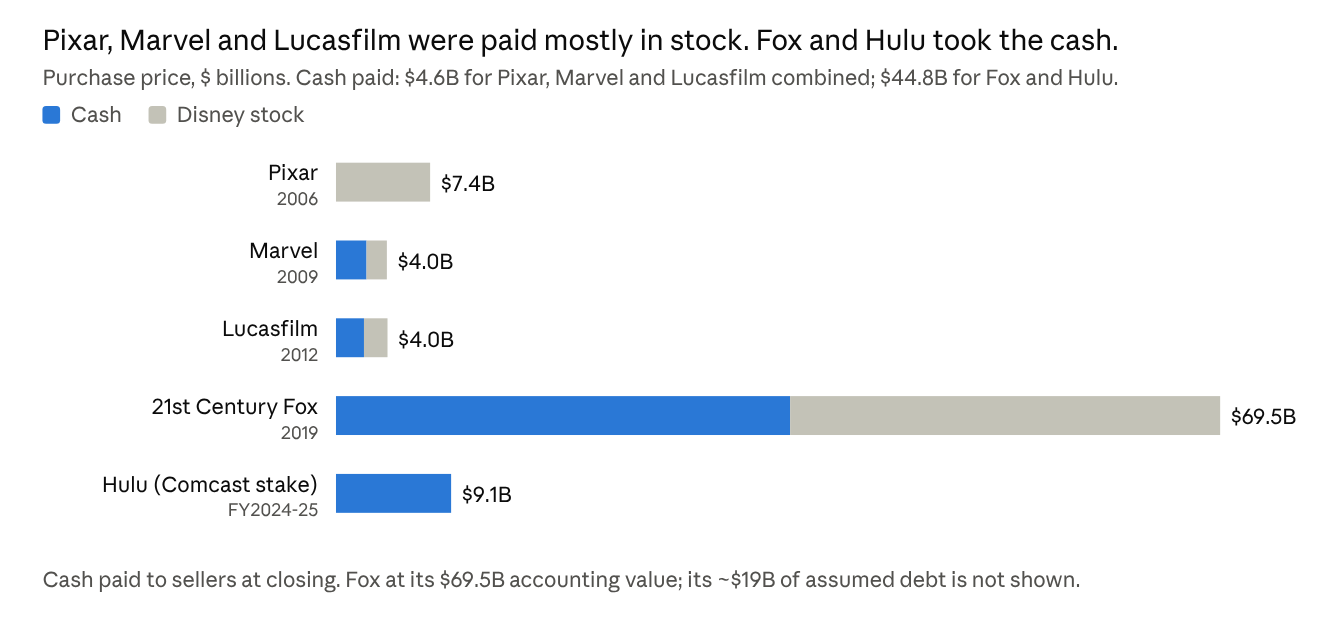
Source: Disney 10-K filings and deal announcements; cash paid to sellers at closing.
Pixar, Marvel and Lucasfilm, which built much of the Disney+ library, cost about $4.6B in cash combined; Disney paid the rest in its own stock, so the sellers shared the risk. Fox and Comcast’s Hulu stake cost about $45B in cash paid to sellers, and Disney also assumed roughly $19B of Fox debt. Those obligations outlasted the CEO who made the deals.
Where the cash went
Disney borrowed to buy Fox, and its debt has not come back down to where it was.
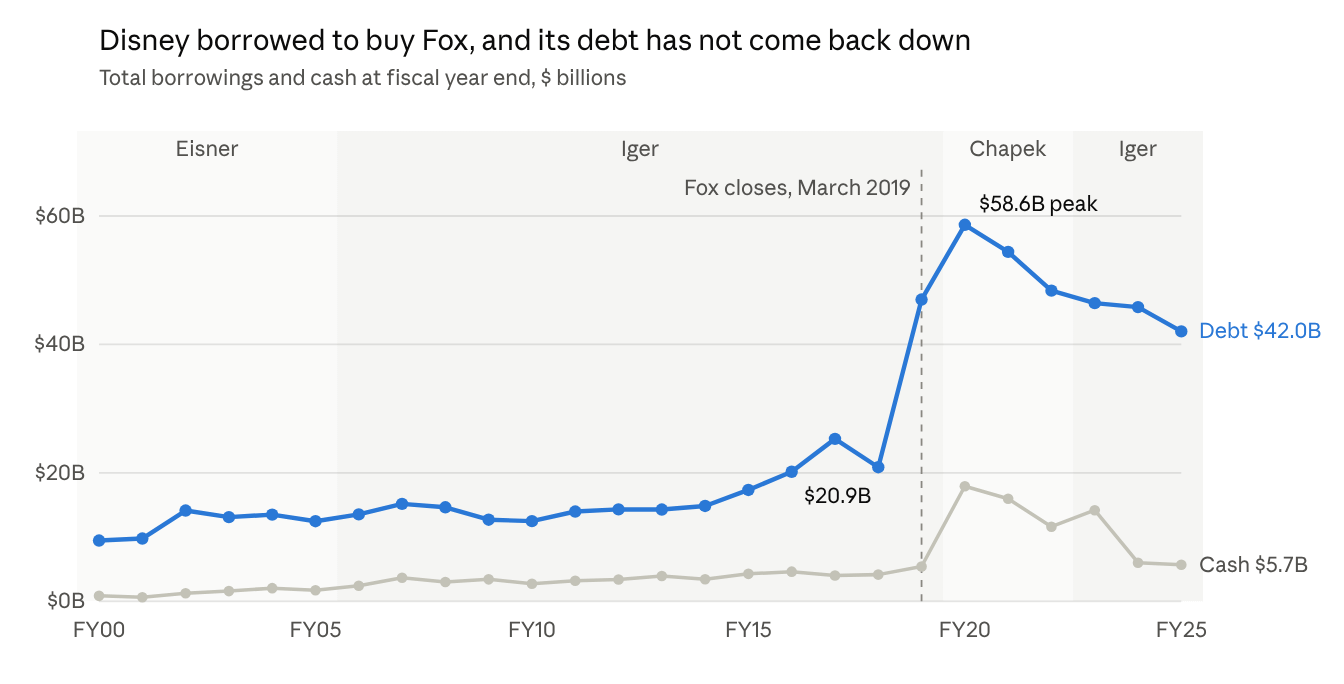
Source: Disney annual reports and Forms 10-K, FY2000 to FY2025; borrowings = current plus long-term.
Disney won Fox at a headline $71.3B after a bidding war with Comcast; its own accounts value the deal at $69.5B, $35.7B in cash and $33.8B in stock. It borrowed $31.1B in bridge loans for the cash, repaid $16.1B of that the next day with cash it acquired, and assumed about $19.2B of Fox’s debt. Borrowings went from $20.9B to $47.0B in a year, then to $58.6B as Disney borrowed through the pandemic. Buying out Comcast’s share of Hulu cost about $9.0B more in FY2024 and FY2025. Interest expense, $682M in FY2018, has run between $1.2B and $2.1B a year since. Fox also brought far more than streaming: studios, FX, National Geographic and, until it was written down and folded into a joint venture, Star India.
So who paid for the streaming build? Segment results show which businesses earned money, not which dollars funded which project, so “the parks paid for streaming” is shorthand. Here is what the segment results do show.
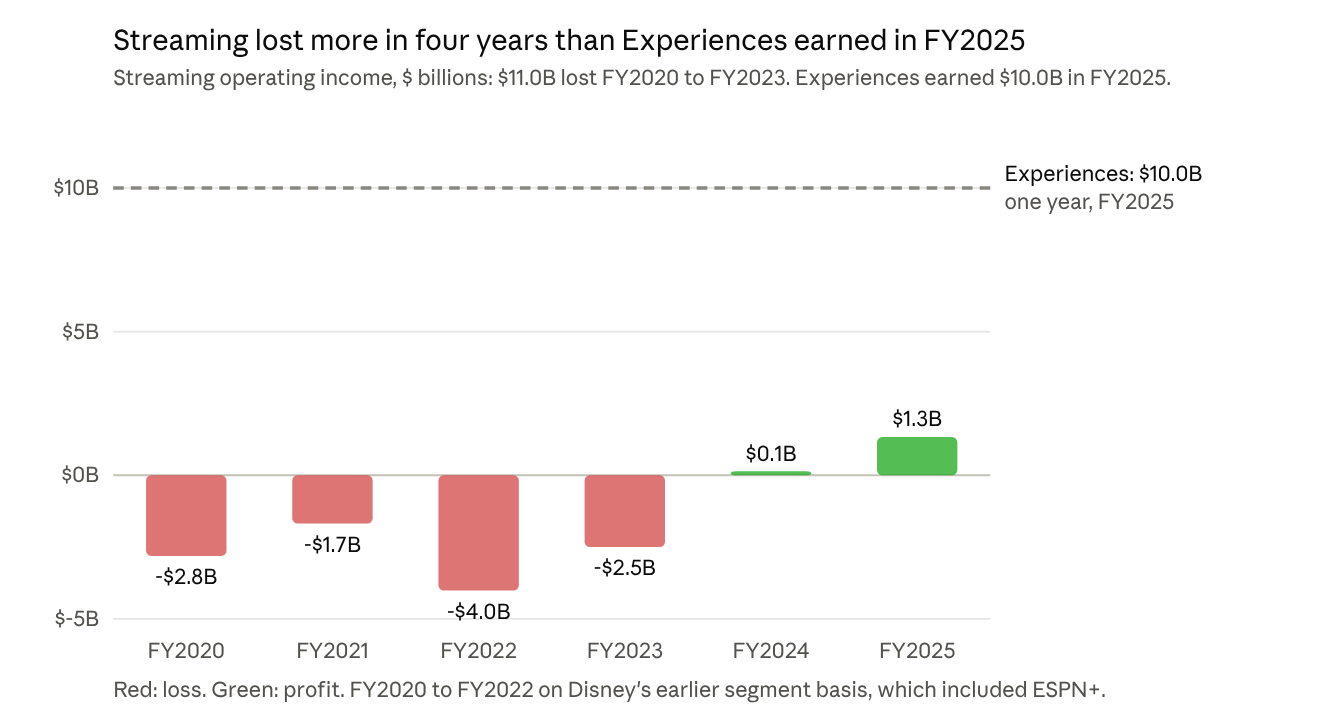
Source: Disney Forms 10-K, FY2020 to FY2025; Direct-to-Consumer and Experiences segment operating income.
Streaming lost about $11B from FY2020 through FY2023. Two businesses earned the profits that carried the company through it. In FY2020, with the parks closed, the Experiences segment lost $81M and the TV networks, including ESPN, earned $9.0B. As the parks reopened, Experiences became the larger engine. In FY2025 it earned $10.0B, 57% of Disney’s segment operating income, while the entertainment networks earned $3.0B and are shrinking.
The budget shows where Disney now expects its returns. In FY2022, it initially budgeted up to $33B of content spending, nearly seven dollars for every dollar of capital spending. This year it is guiding to $24B of content and about $9B of company-wide capex.
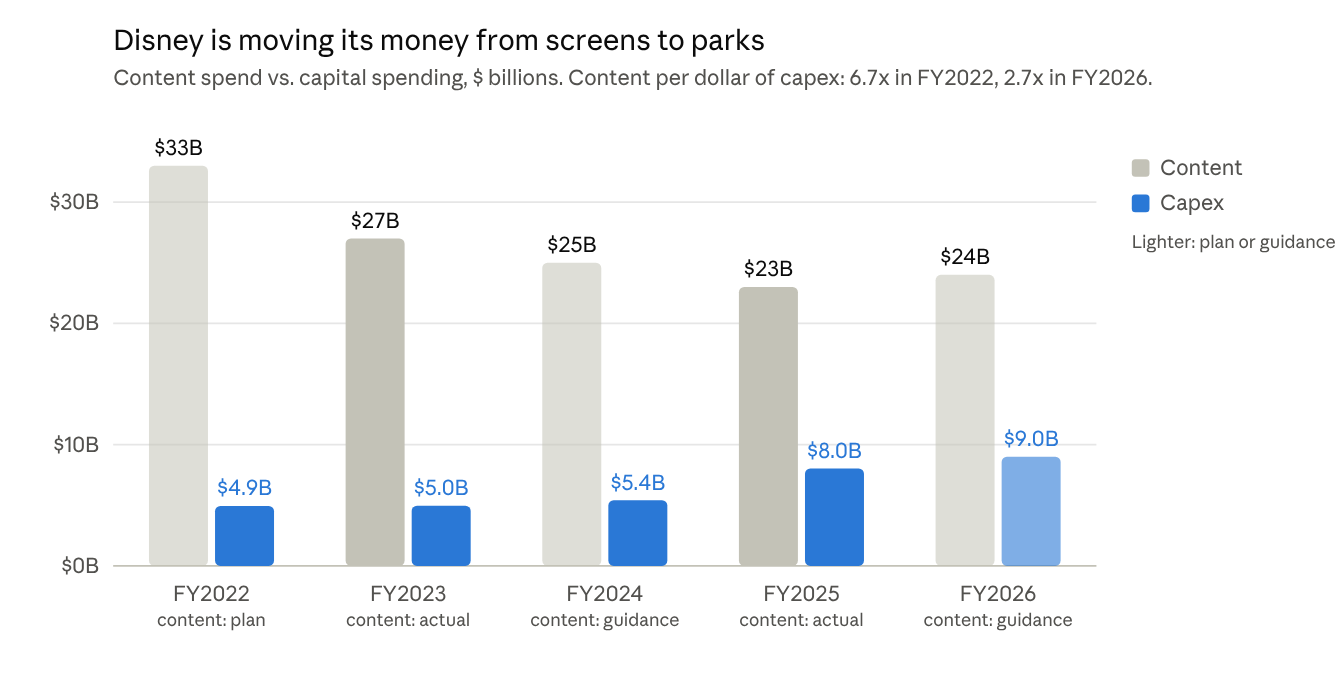
Source: Disney earnings calls and Forms 10-K; content spend includes sports rights; capex is company-wide, mostly parks and cruise.
Last fiscal year, operating cash covered capex, buybacks and dividends: $18.1B from operations paid for $8.0B of capital spending, $3.5B of buybacks and $1.8B of dividends, and borrowings fell. This fiscal year looks different. Disney raised its buyback target to at least $9B.
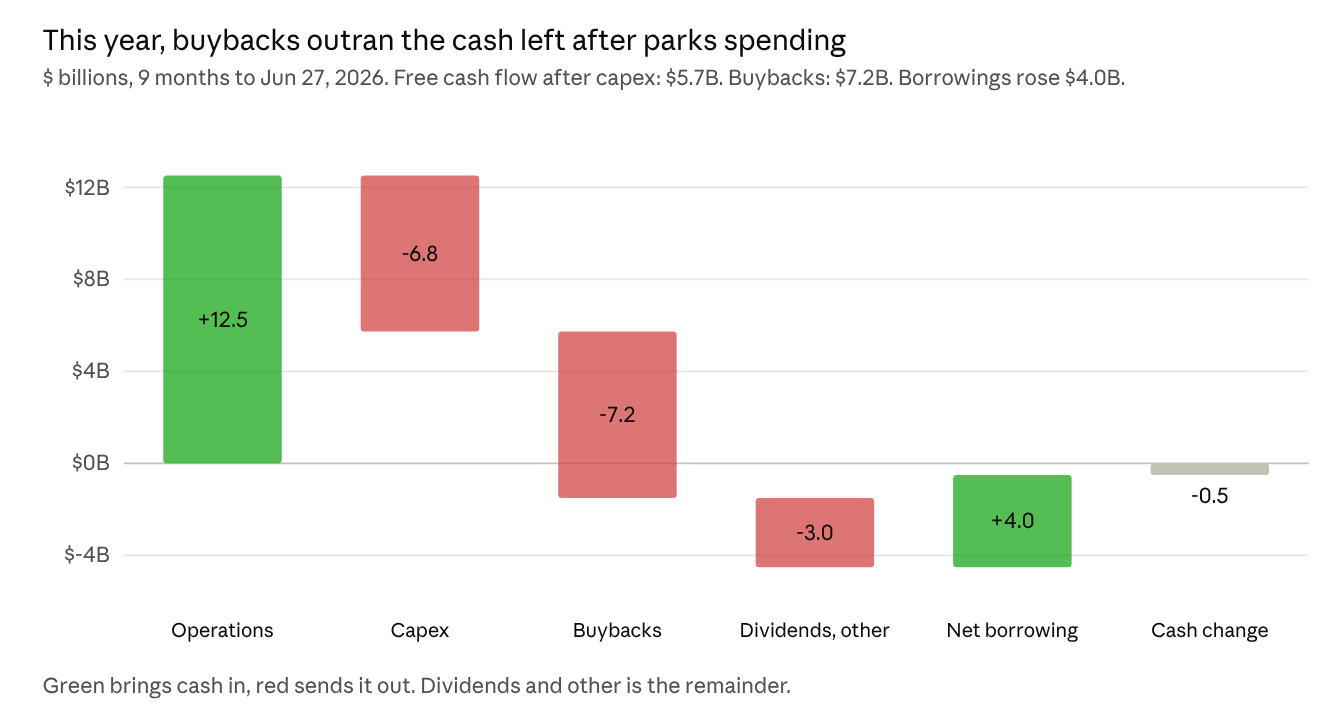
Source: Disney Form 10-Q for the quarter ended June 27, 2026.
In the first nine months of FY2026, Disney generated $12.5B from operations and spent $6.8B on capital projects, leaving $5.7B. It spent $7.2B on buybacks. It also sold $4B of bonds in February, its first since 2020, and borrowings rose from $42.0B to $46.0B. Two qualifiers: this year’s operating cash included paying taxes Disney had deferred, and management tied the larger buyback partly to cash once set aside for its OpenAI deal and to expected proceeds from the A+E sale. Disney does tie some cruise-ship financing directly to debt: its FY2025 report shows $1.1B borrowed for each of Disney Treasure and Disney Destiny, export-credit loans repaid over 12 years.
What streaming earns, and where it comes from
Disney+ and Hulu reported 131.6M and 64.1M paid subscriptions at the end of FY2025. Those are counts of subscriptions to each service, not unique households.
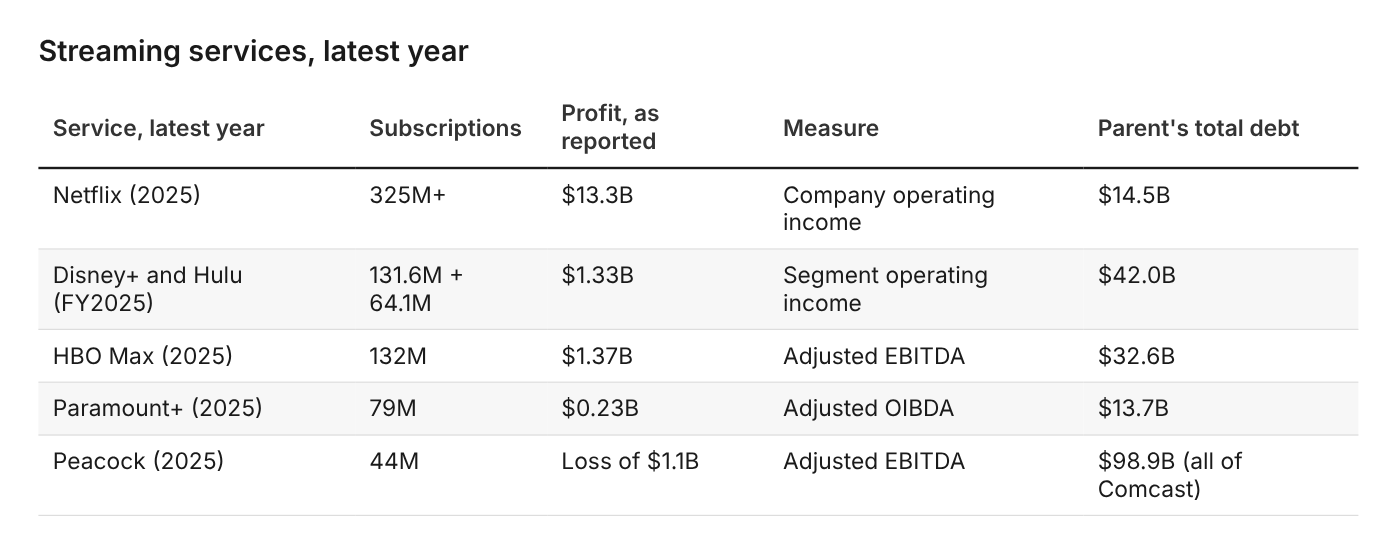
The measures differ, so treat this as context, not a ranking. Netflix is a pure streamer; the others carry studios, networks and, in Disney’s case, parks on the same balance sheet.
What people watch is a separate question from what wins or keeps subscribers.
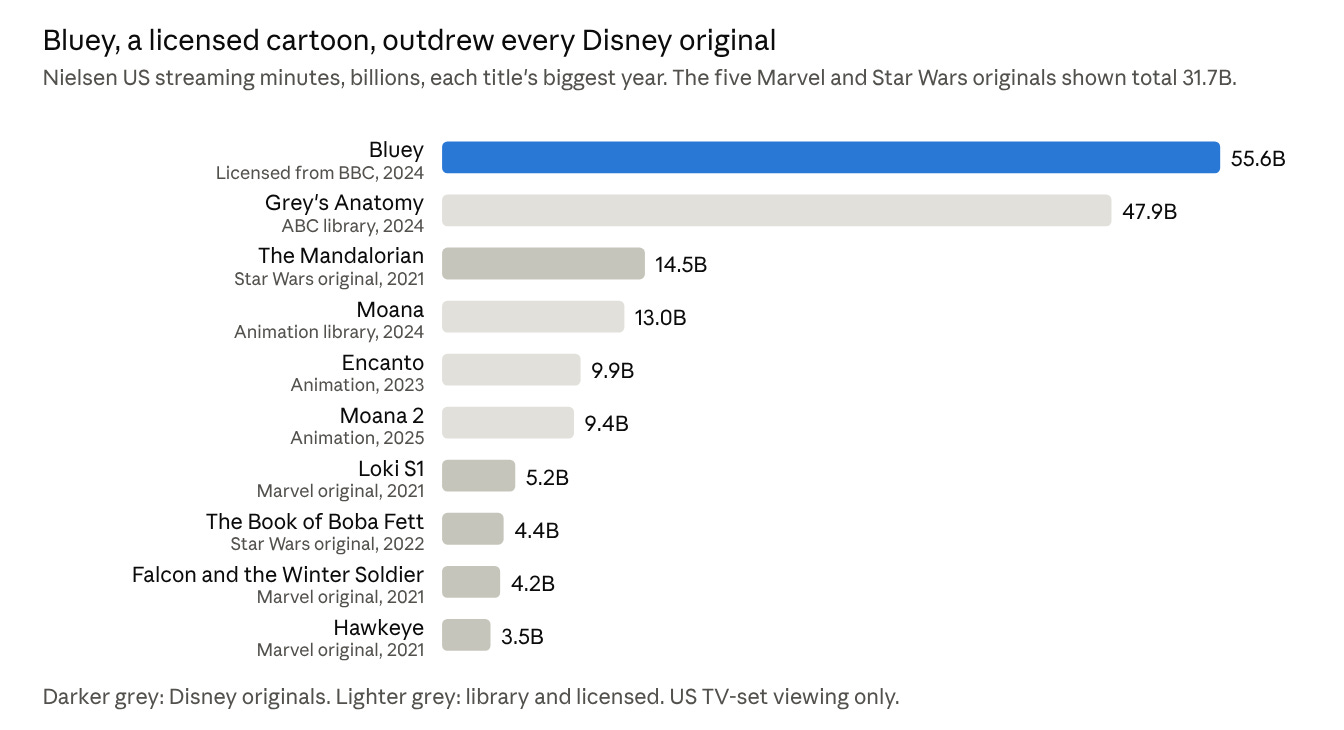
Source: Nielsen streaming charts via The Hollywood Reporter, Variety and TheWrap; 2021 to 2025.
The Mandalorian was a genuine hit: in the week of December 14, 2020, its 16 episodes drew 1.3 billion minutes, making it the first show outside Netflix to top Nielsen’s weekly streaming chart. But the most-watched title on Disney’s services is Bluey, which Disney licenses from BBC Studios. Minutes favor long catalogs, so the viewing chart above shows what fills the hours, not which shows earned their budgets. Quarterly subscriber additions cannot isolate a title either: a show can reduce cancellations without producing a visible spike.
Bluey is still the clearest case of licensed IP feeding the flywheel. After it became the top show on US streaming, Disney brought it into Animal Kingdom, Disneyland and its cruises. Disney licenses Bluey from BBC Studios rather than owning the franchise; Ludo Studio produces the show, and Disney’s role in the coming film is theatrical distribution.
Estimated annualized revenue across Disney+ and Hulu rose from about $11.7B in the fiscal fourth quarter of 2021 to $21.4B four years later. This is a run rate, not reported annual revenue: quarter-end paid subscriptions times that quarter’s monthly revenue per subscription, which includes advertising, times 12. It covers three reported series: Disney+ domestic (US and Canada), Disney+ international excluding Hotstar, and Hulu SVOD. Valuing the added subscriptions at 2021 revenue per subscription, they account for 74% of the increase; valuing them at the 2025 rate, 86%. Either way, most of the growth came from volume. The rest came from higher revenue per subscription, mostly outside the US; Hulu’s fell. Disney allocates bundle revenue across the services, so the split also depends on its allocation.
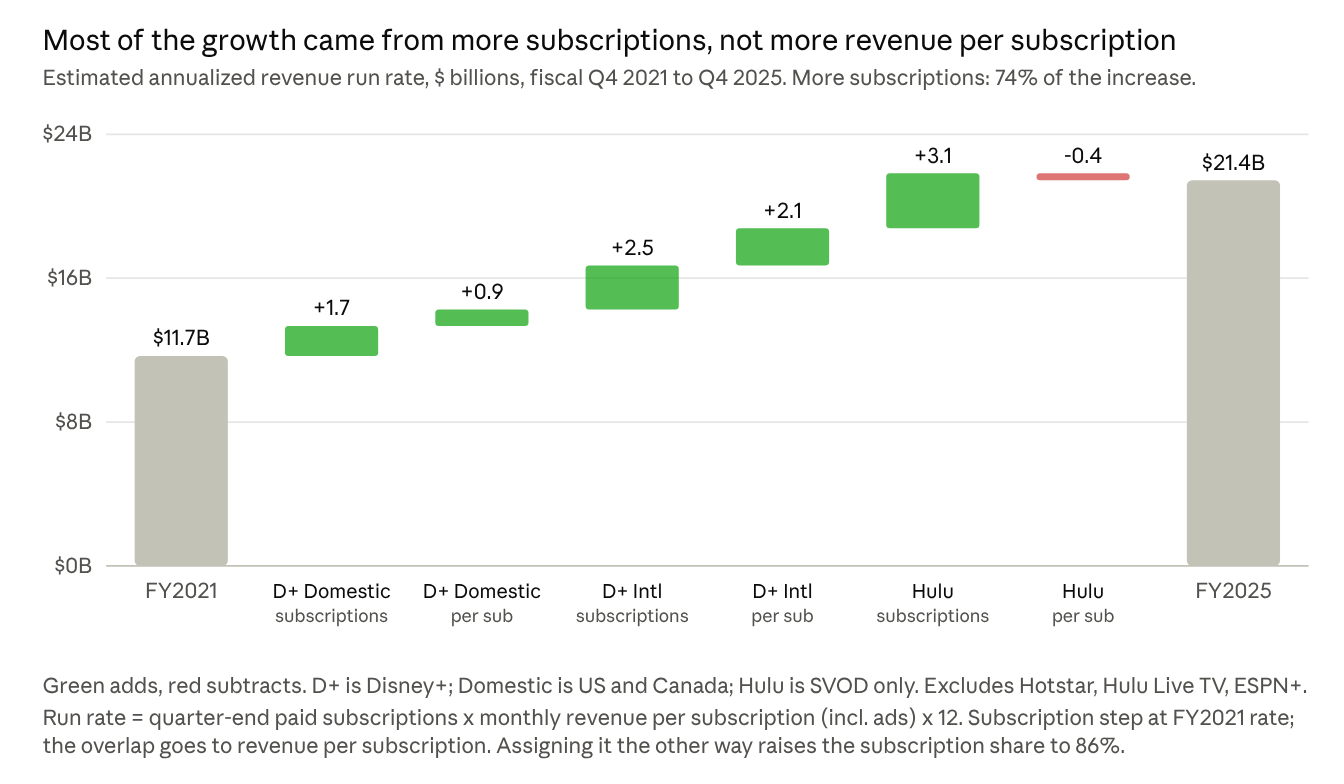
Source: Disney quarterly earnings releases; year-end subscriptions times fourth-quarter monthly revenue per subscription, times 12.
Many of those subscriptions came in through cheaper channels: the ad tier, bundles, and wholesale deals like Charter’s.
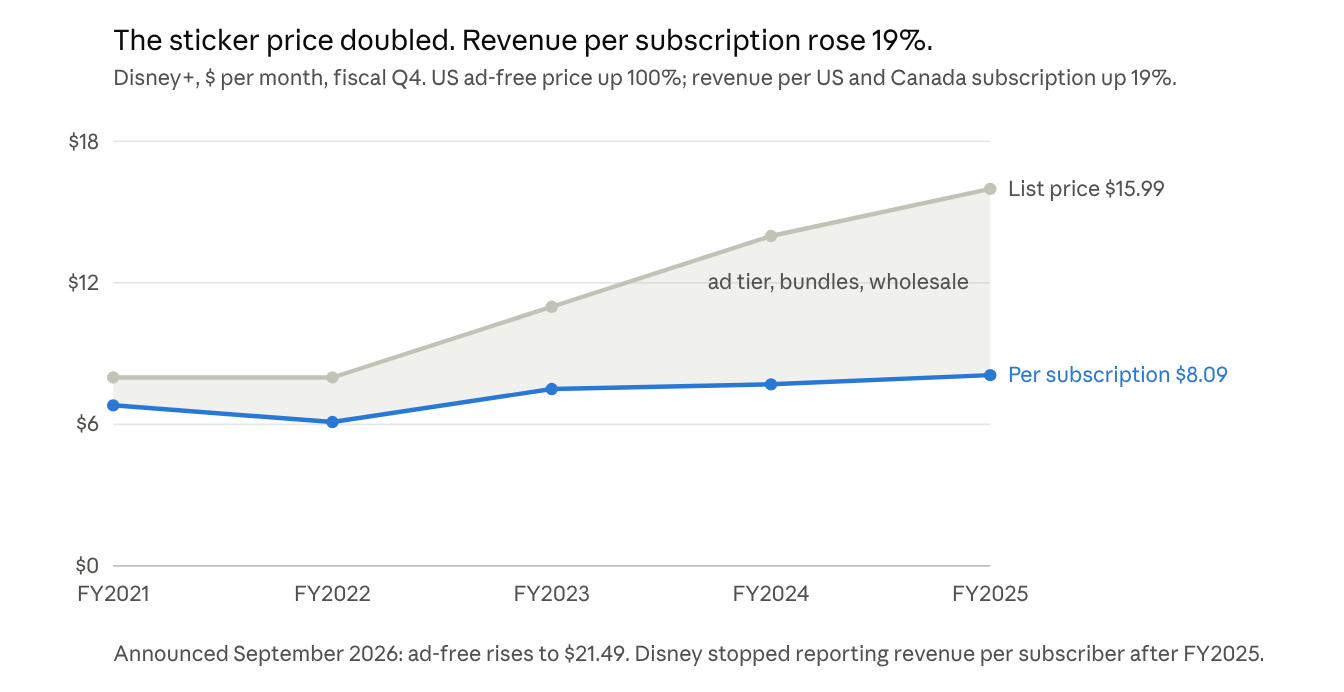
Source: Disney quarterly earnings releases and published US price changes; revenue per subscription includes advertising.
Reported revenue per subscription includes advertising and bundle allocations, so it is not the same as what a household pays. But the gap is the point: from September 2021 to September 2025, the US ad-free price doubled, from $7.99 to $15.99, while reported revenue per domestic Disney+ subscription rose 19%, from $6.81 to $8.09. Disney stopped reporting both subscriptions and revenue per subscription after September 2025.
Earning it back, and the balance
In accounting terms, streaming already covers its programming, marketing and technology costs. What it has not done is recover the operating losses it took to get here. Nobody publishes a date, so I built a simple estimate, shown as cumulative operating-profit recovery rather than a cash return on Fox or Hulu.
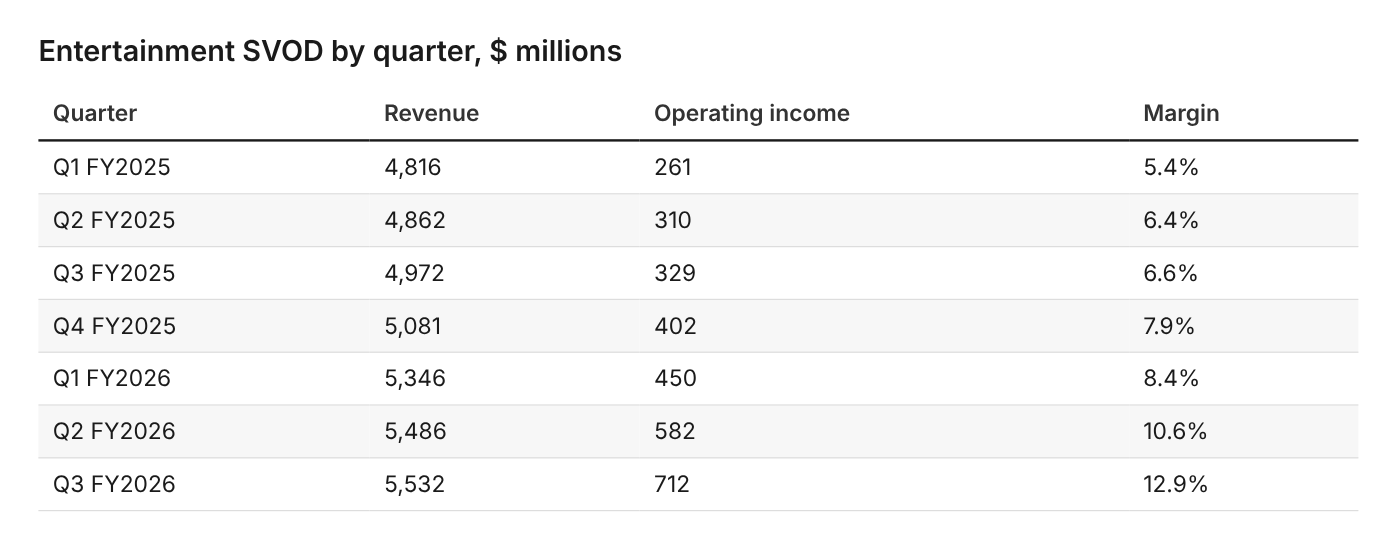
Disney reports streaming on two bases. The Direct-to-Consumer line includes its virtual pay-TV services, Hulu Live TV and now Fubo. Since the first quarter of FY2026, Disney has also published a narrower SVOD income statement that excludes them, and that is the basis of its margin guidance, so the forecast below is built on it. In the first three quarters of FY2026, SVOD revenue was $16.4B and operating income $1.74B, a 10.7% margin. For all of FY2025, Disney’s supplemental SVOD statement shows $19.7B of revenue and $1.30B of operating income, a 6.6% margin. The one estimate is FY2026’s fourth quarter, which I put at about $5.6B of revenue and a 9% margin, reflecting the softer advertising Disney flagged. Management first guided to a 10% SVOD margin for this year and in August said double-digit, excluding the 53rd week; I keep 10% as the conservative case.
The losses being recovered sit on older bases. FY2020 to FY2022 include ESPN+, and every year includes Hulu Live TV; Disney has not restated them on an SVOD basis. In FY2025 the gap between the two lines was just $25M of operating income, so the virtual pay-TV business ran near breakeven and moves the totals little. ESPN+ makes the $11.0B somewhat higher than the SVOD services’ own losses, so the dates below lean conservative.
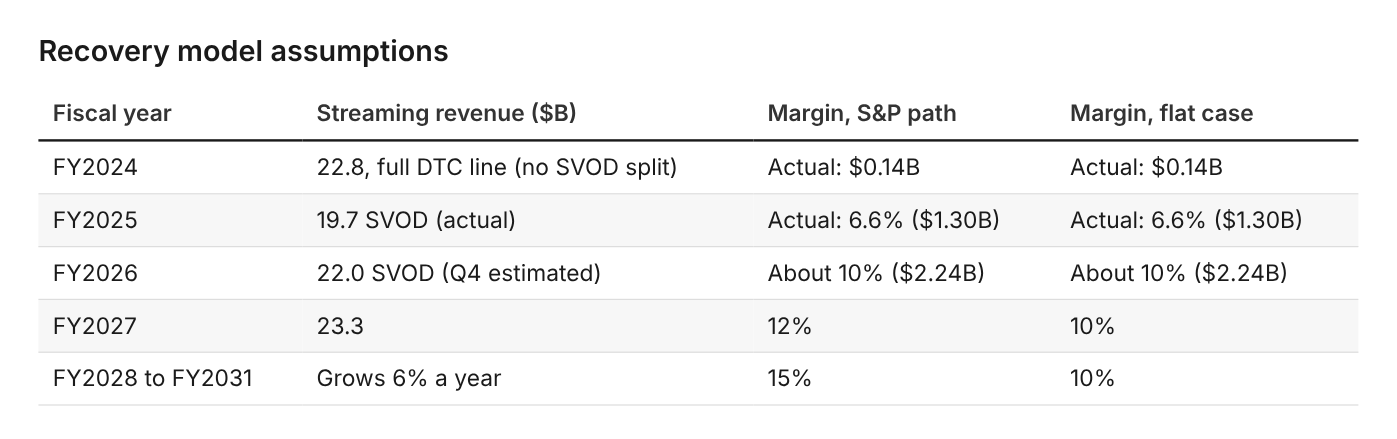
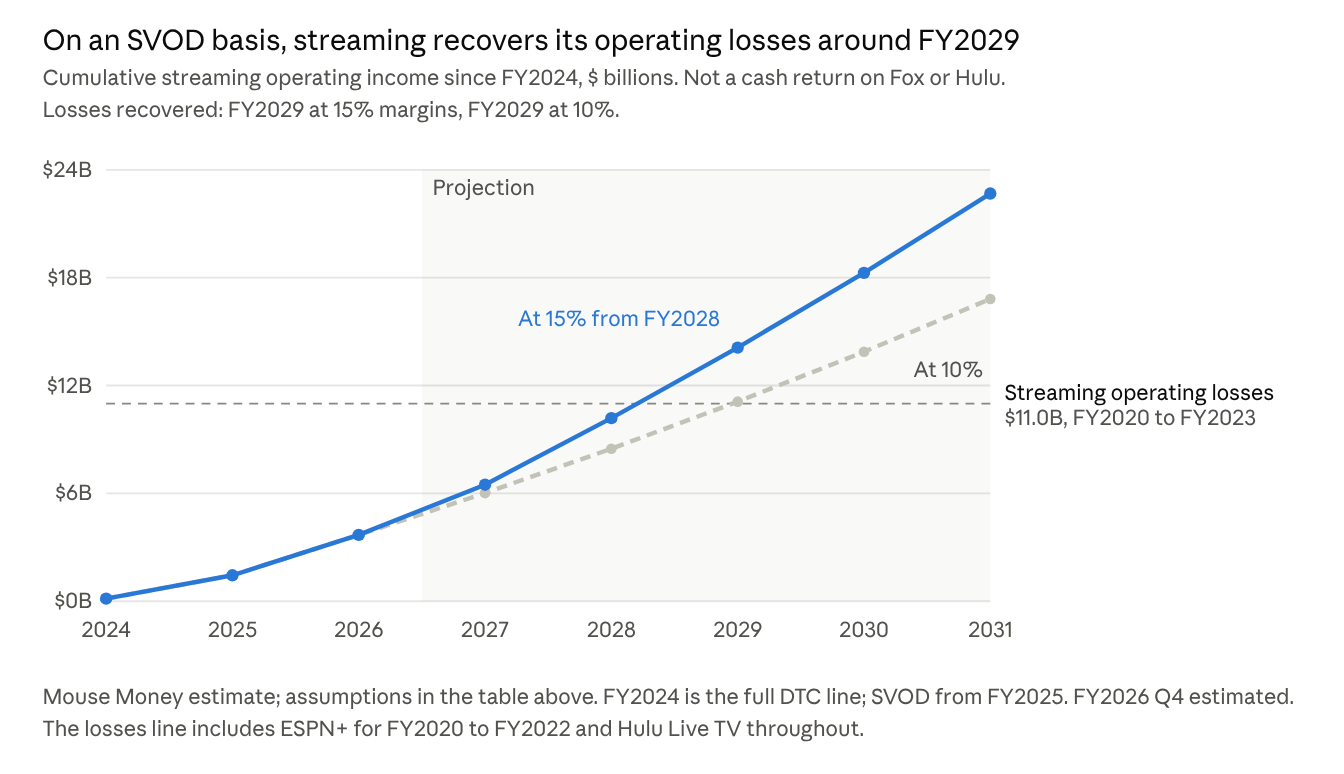
Source: Mouse Money estimate from Disney’s SVOD supplemental disclosures (Q1 to Q3 FY2026) and segment results; 15% margin path from S&P Global Ratings (Dec 2024).
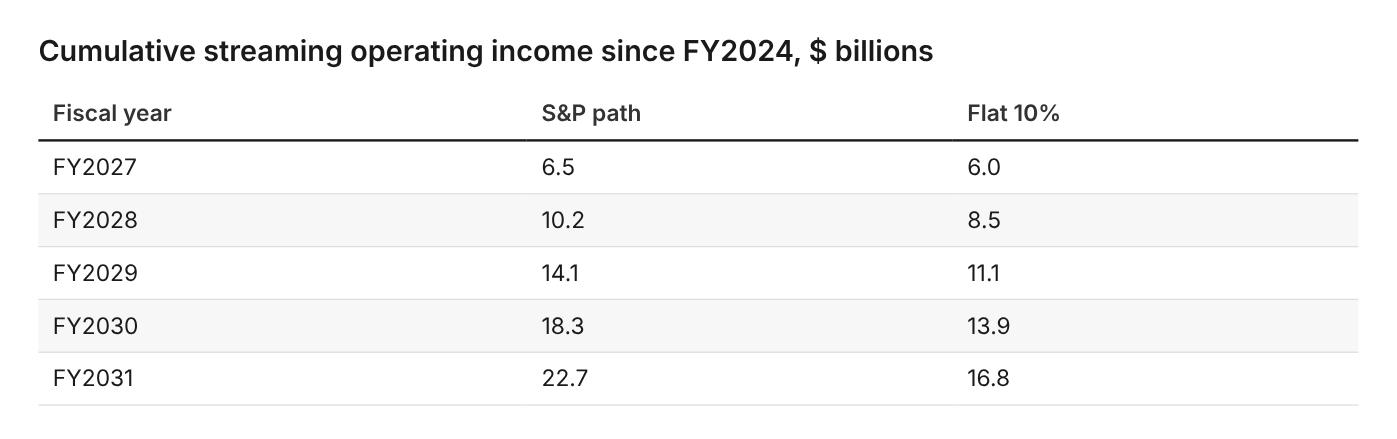
In the recovery chart, the dashed line is streaming’s operating losses from FY2020 to FY2023, $11.0B. On S&P’s path, cumulative profit since FY2024 reaches $10.2B in FY2028 and $14.1B in FY2029. At a flat 10%, it reaches $11.1B in FY2029, only just, so any shortfall pushes recovery to FY2030. The data appendix below adds an illustrative case that also charges streaming with Disney’s extra interest since FY2018.
Whether Disney has the balance right comes down to three tests:
Streaming margins keep climbing. The third quarter reached 12.9%, helped in part by the timing of marketing and programming spend. S&P expects 15% by FY2028. If margins stall near 10%, recovery slips toward FY2030 and the rest of Disney carries more of the balance sheet for longer.
Experiences spending adds guests, not just price. In FY2025, US park attendance fell 1% while per-guest spending on tickets, food, drinks and merchandise rose 5%. The $60B plan has to add rides, rooms and ships that bring more people in.
The balance sheet keeps its A. When S&P raised Disney to A in December 2024, it said it expects S&P-adjusted leverage to stay below 2.5 times, the threshold it set for the upgrade. S&P’s adjusted measure includes more than borrowings, and I have not recalculated it. What is visible is the direction: this year buybacks ran ahead of the cash left after capex, and borrowings rose $4B.
Two views of what comes next
Wells Fargo’s Steven Cahall, who rates the stock Overweight, argued in July that Disney should go back to making content and license it to other streamers: “We think it could add ~40% to the stock price.” Goldman’s Michael Ng takes a different view, calling Disney “a multi-year earnings compounder” early in “a broader product and Experiences investment cycle.”
Management sides with Ng. Disney+ is to become “the digital centerpiece of our company,” D’Amaro told shareholders in March, while the parks run on “the largest capital investment plan in Disney Experiences’ history.” Nelson Peltz’s firm, Trian, argued in January 2023 that Disney was “overearning in the Parks business to subsidize streaming losses.” Peltz lost his 2024 proxy fight, but his question is still the right one to ask.
The cash to watch
Streaming now earns a profit. Whether that settles the question depends on how Disney splits its cash. When it reports in November, watch three figures for next year: buybacks, capital spending on the parks plan, and debt repayment. If buybacks keep running ahead of free cash flow while the parks plan accelerates, the room for a slowdown at the parks gets smaller.
Data appendix

FY2019 to FY2025 totals $11.8B, about $7.1B above seven years at the FY2018 level. Adding that $7.1B to streaming’s $11.0B of losses raises the bar to $18.1B: on S&P’s margin path it is reached in FY2030, and at a flat 10% not before FY2032. Treat that only as an illustration, because the extra interest also reflects Fox’s other businesses, pandemic borrowing and higher rates.
Sources
Disney 10-K filings FY2018 to FY2025 and quarterly earnings releases (borrowings, cash, interest, segment results, subscribers): FY2025 10-K
Wanda Group, Jul 2017: revised transaction with Sunac and R&F
Reuters, Jun 2010: Disney hopes Toy Story 3 merchandise reaps $2.4 billion
Disney investor presentation, Mar 2024 (1957 synergy map, slide 57)
Disney FY2025 results (cash flow, buybacks, dividends, subscriptions)
Disney FY2025 annual report (Hulu buyout, cruise financing, park attendance)
Disney Q1 FY2026 results (SVOD supplemental income statement)